LAYERd

Assignment,Final Project,Hardware,Software — Tags: — John Mars @ 10:45 pm

LAYERd is a multi-layer display made from off-the shelf computer monitors. It allows for glasses-free 3D as well as a novel way to envision User Interfaces.

Every LCD screen on the planet is made of two main parts: a transparent assembly (made of laminated glass, liquid crystal, and polarizing filters) and a backlight. Without the backlight, an LCD monitor is actually completely transparent wherever a white pixel is drawn.

LAYERd uses three of these LCD assemblies illuminated by a single backlight to create a screen with real depth: objects drawn on the front display are physically in front of objects drawn on the rear ones.

My work is mainly focused on the potential UI uses for such a display: what can one do with discrete physical layers in space?

PROCESS

The process begins by disassembling the three monitors. After destroying two cheaper ones with static electricity before the project began in earnest, I was very careful to keep the delicate electronics grounded at all times, and I worked on top of an anti-static mat and used an anti-static wristband when possible.


With some careful prying, the whole thing came undone.


Here, you can see how the glass panel is transparent, and how the backlight illuminates it.

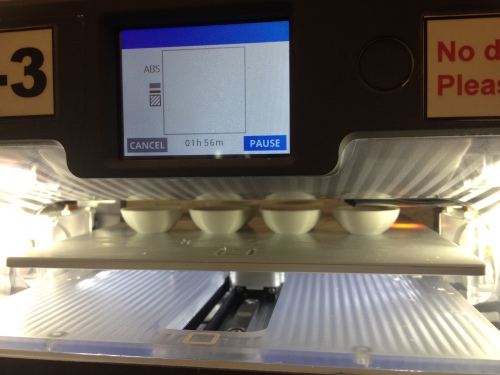
After disassembly came the design, laser cutting, and assembly of the frames and display.

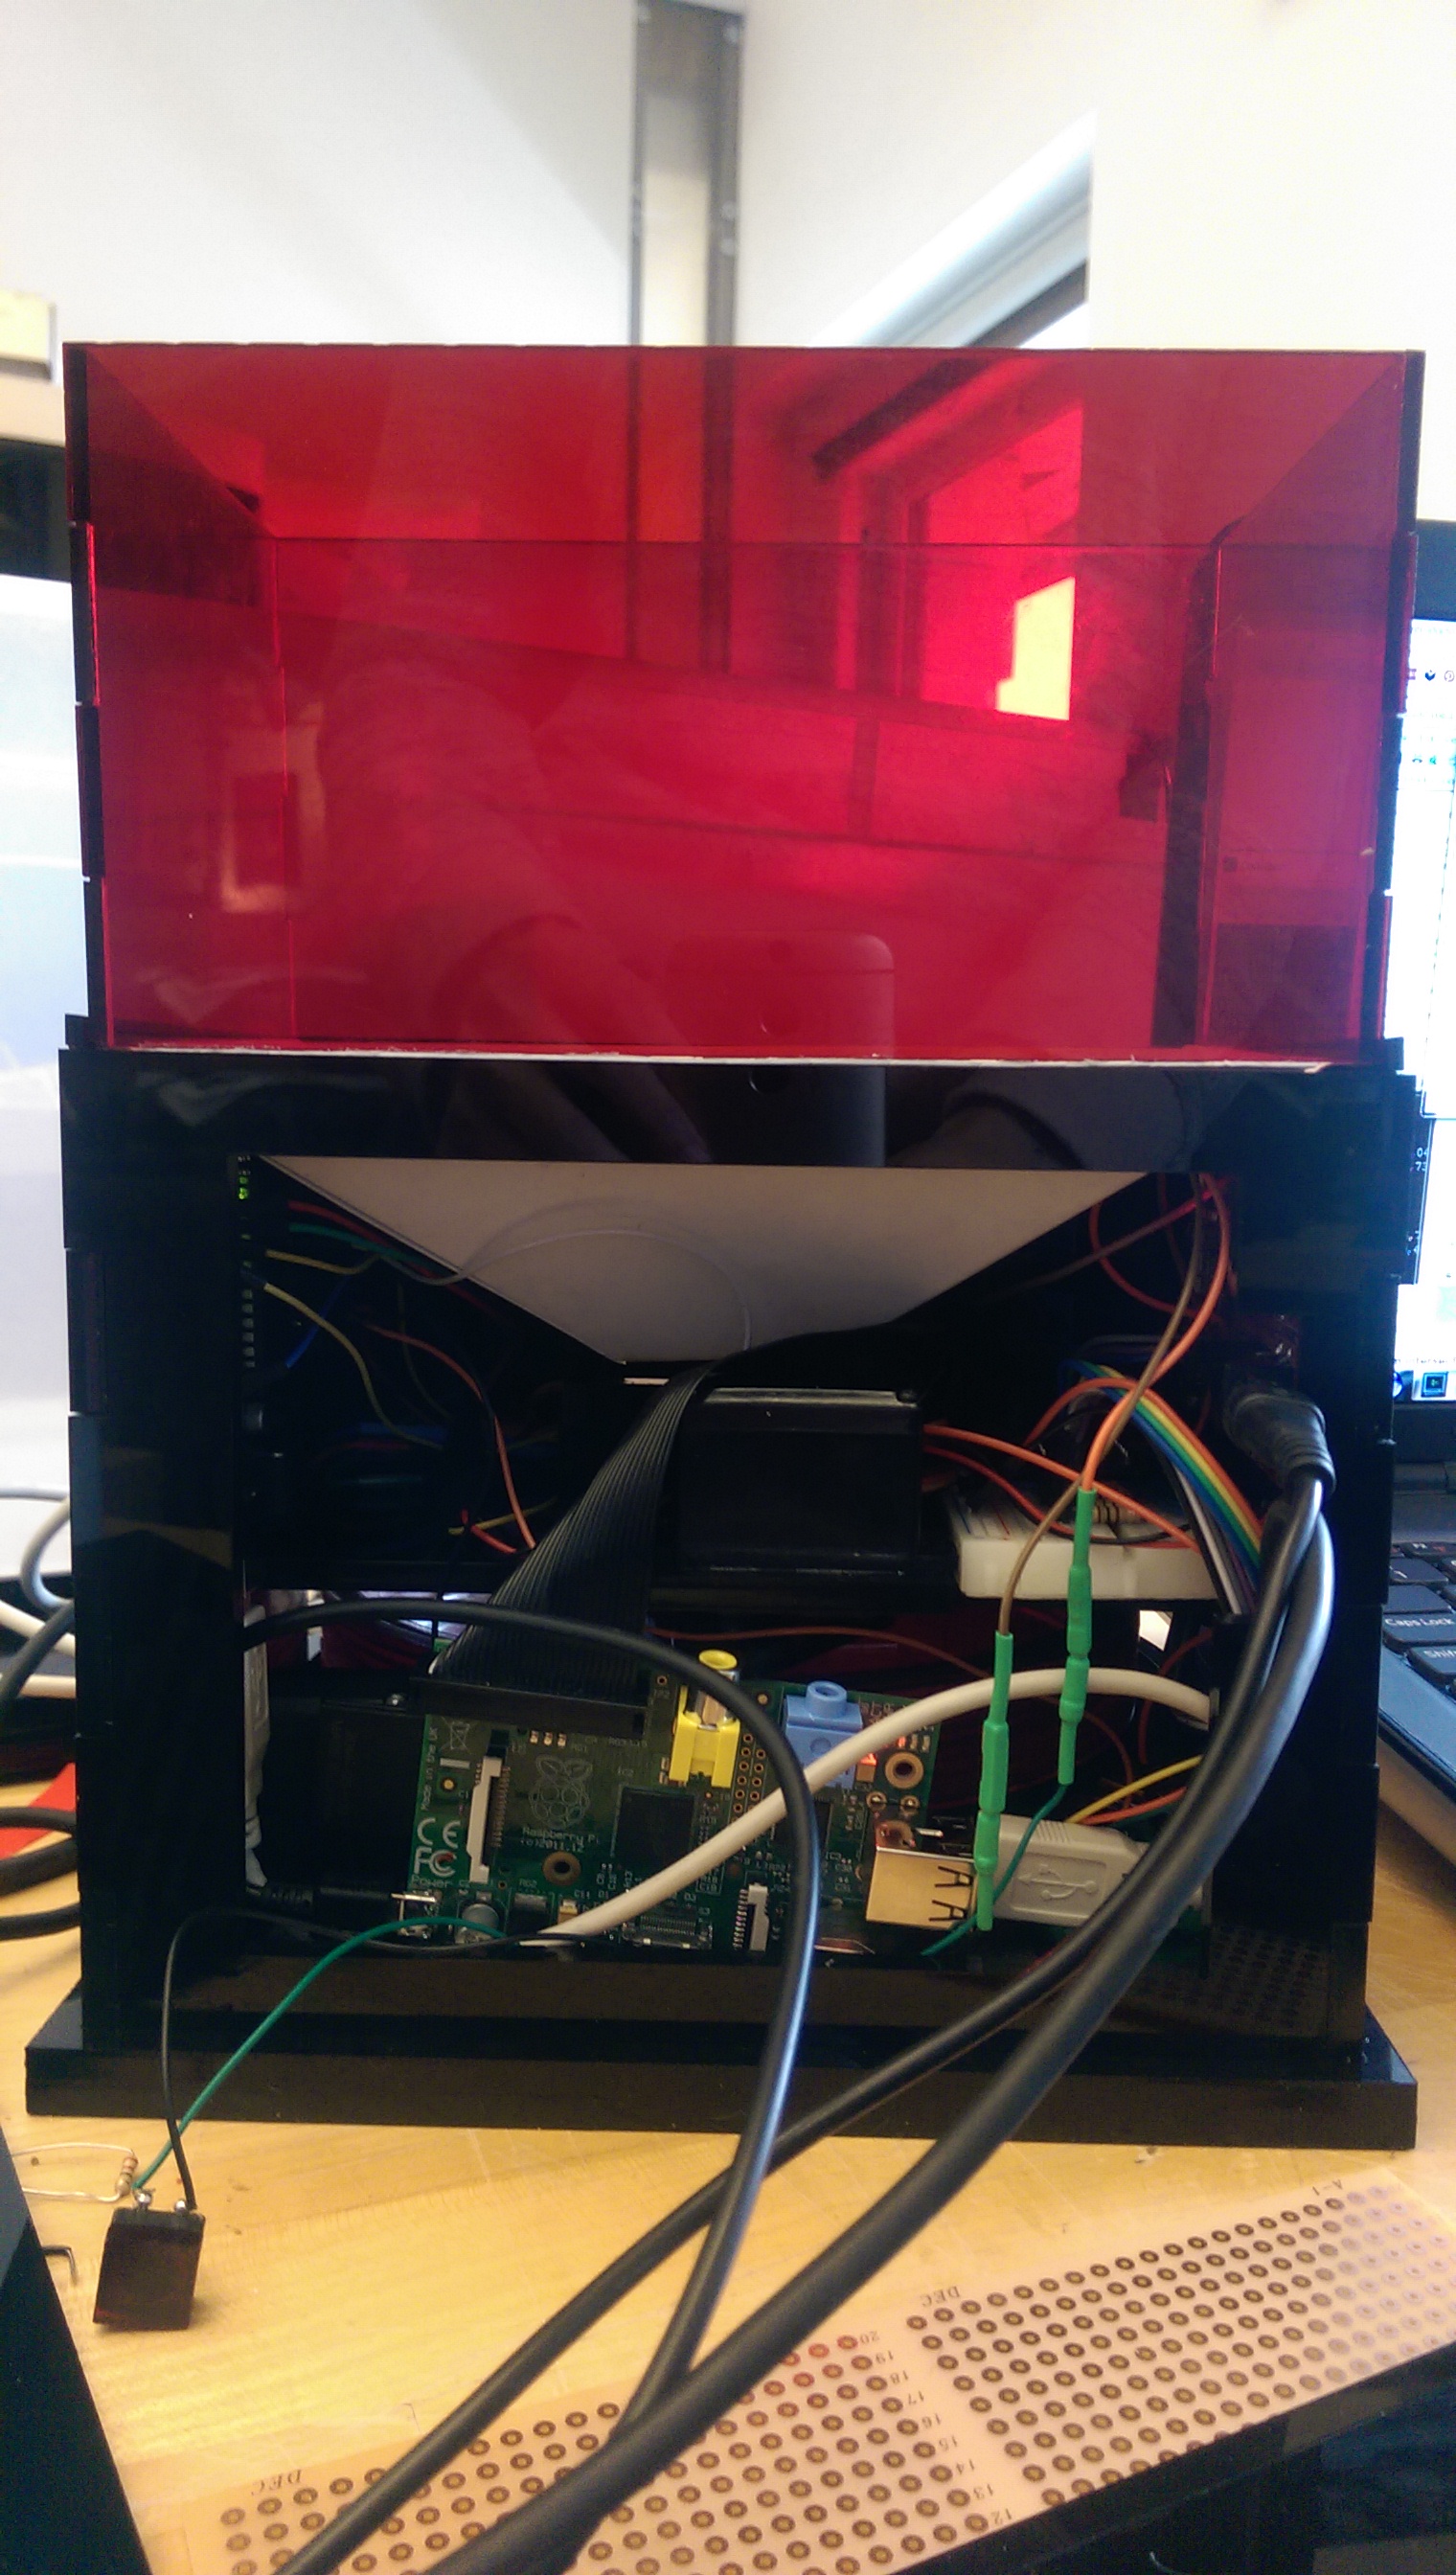
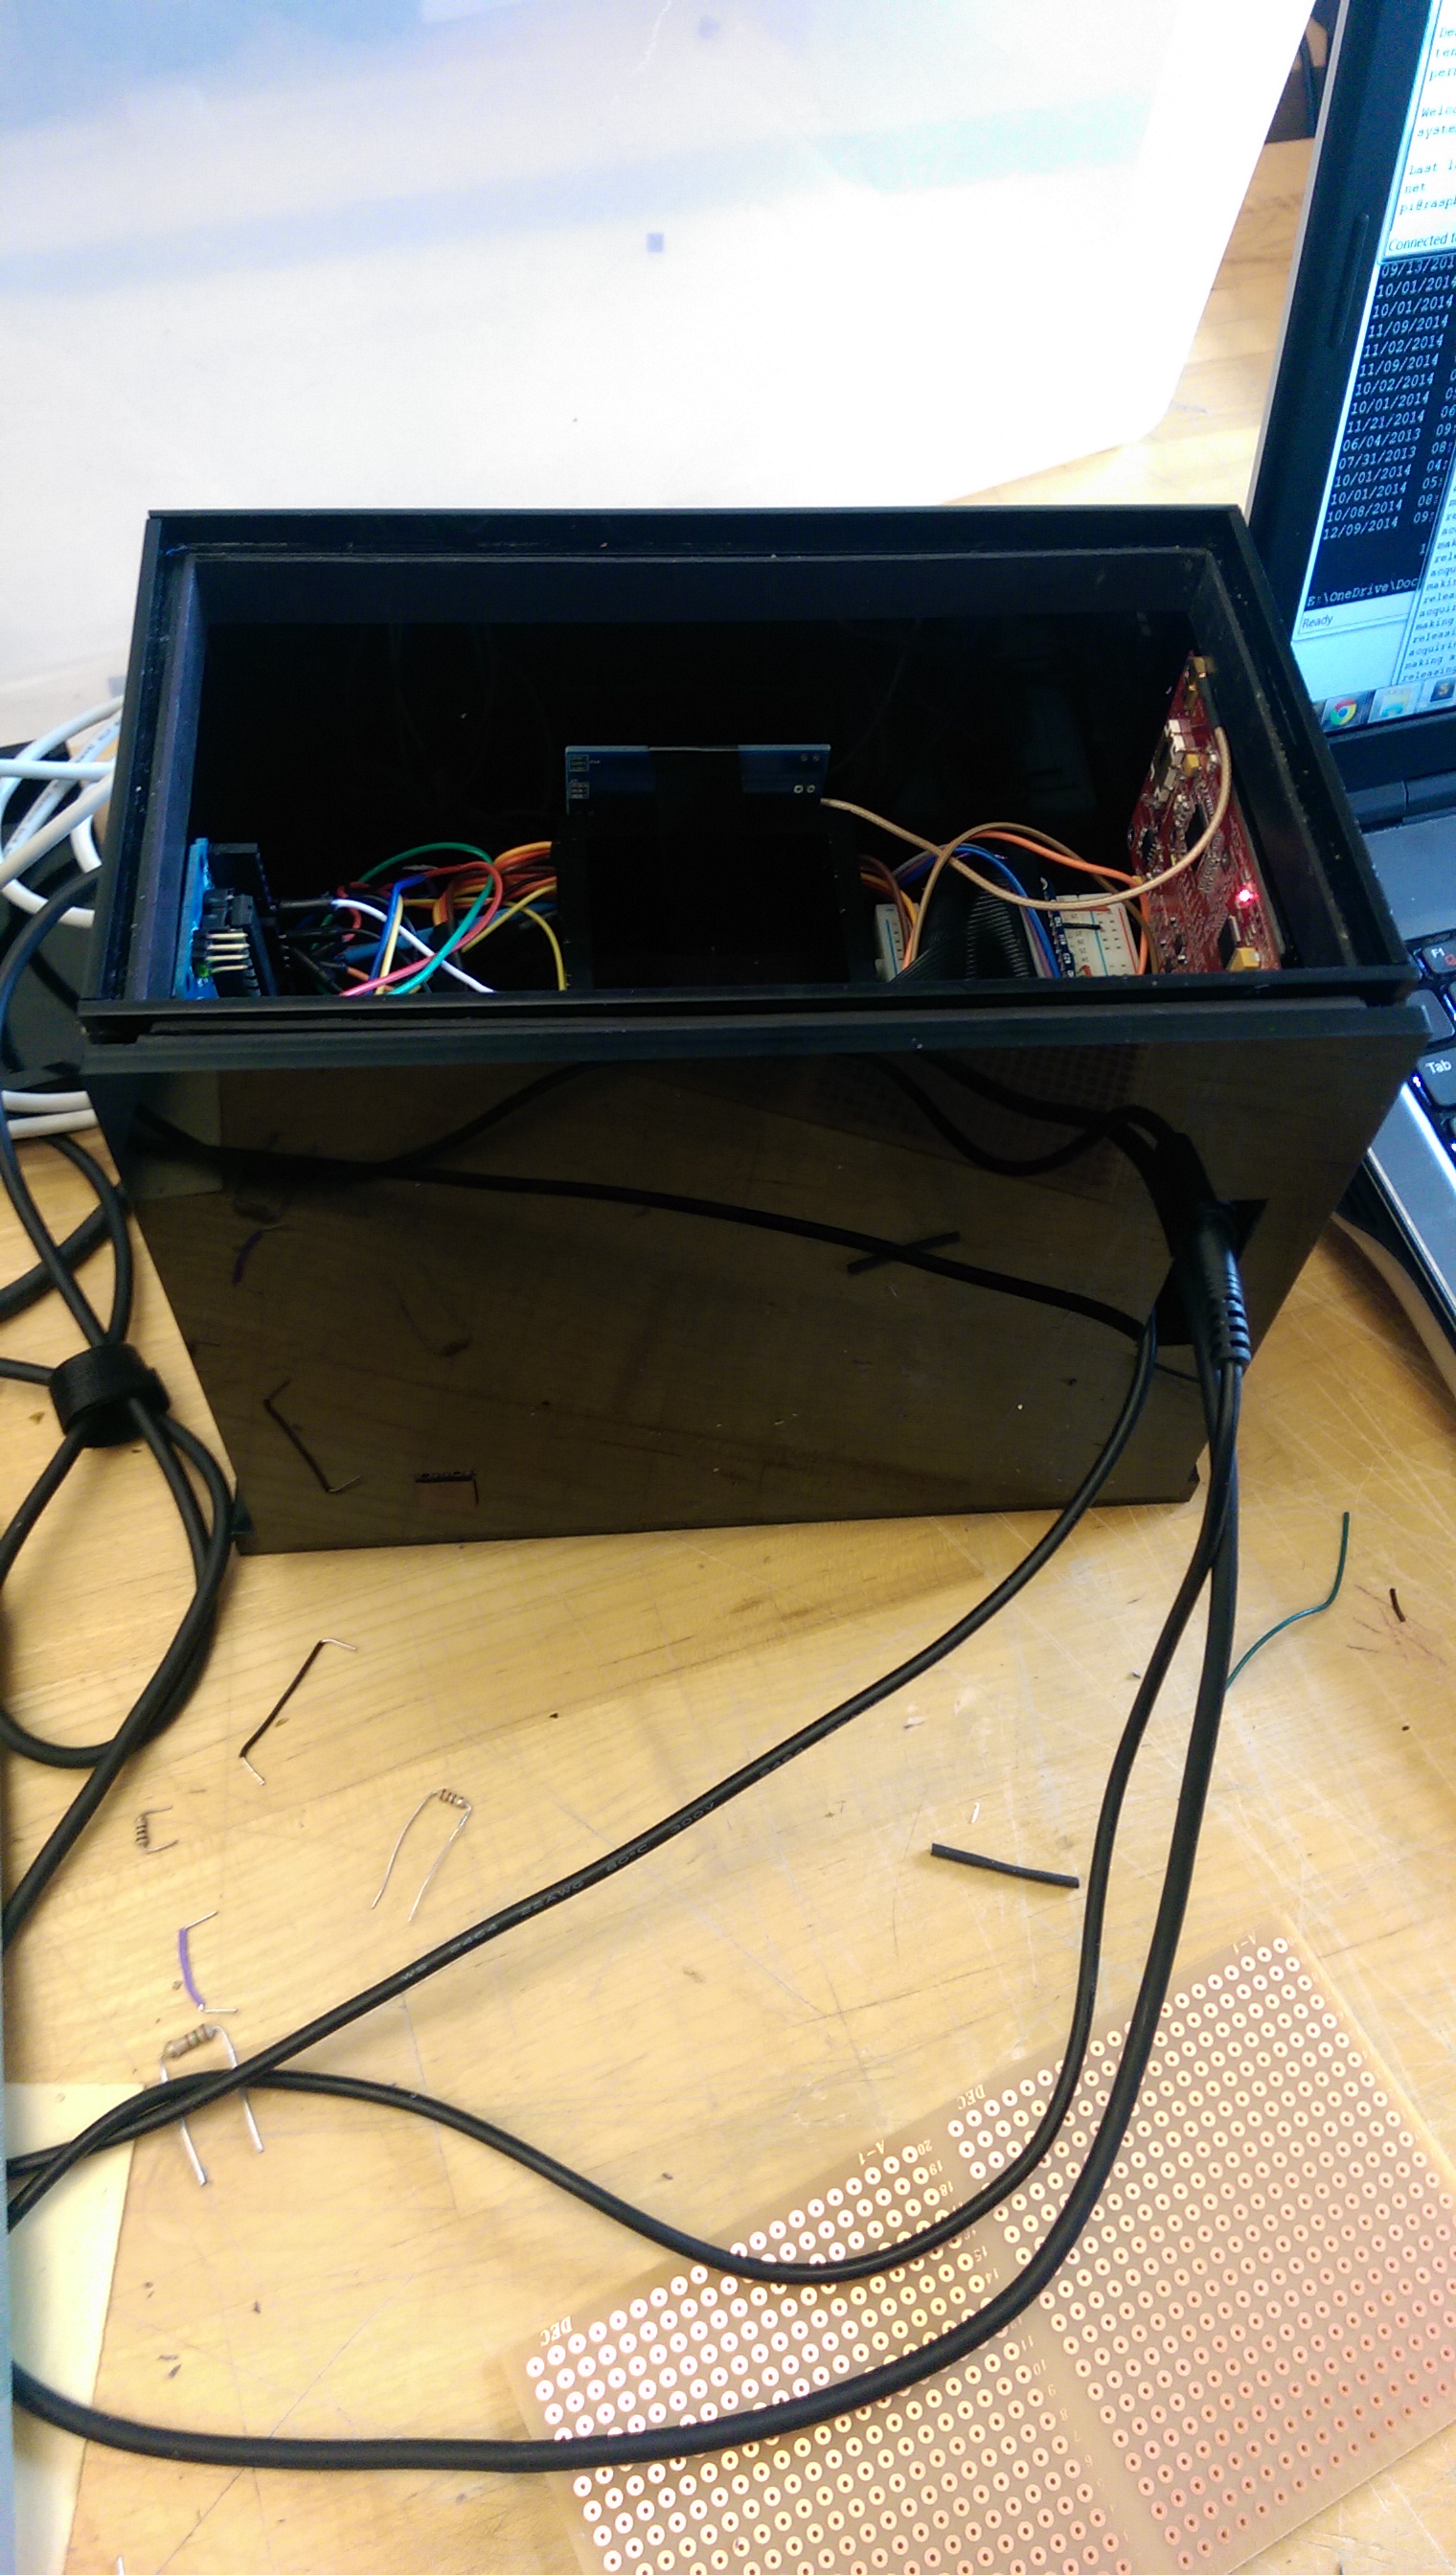
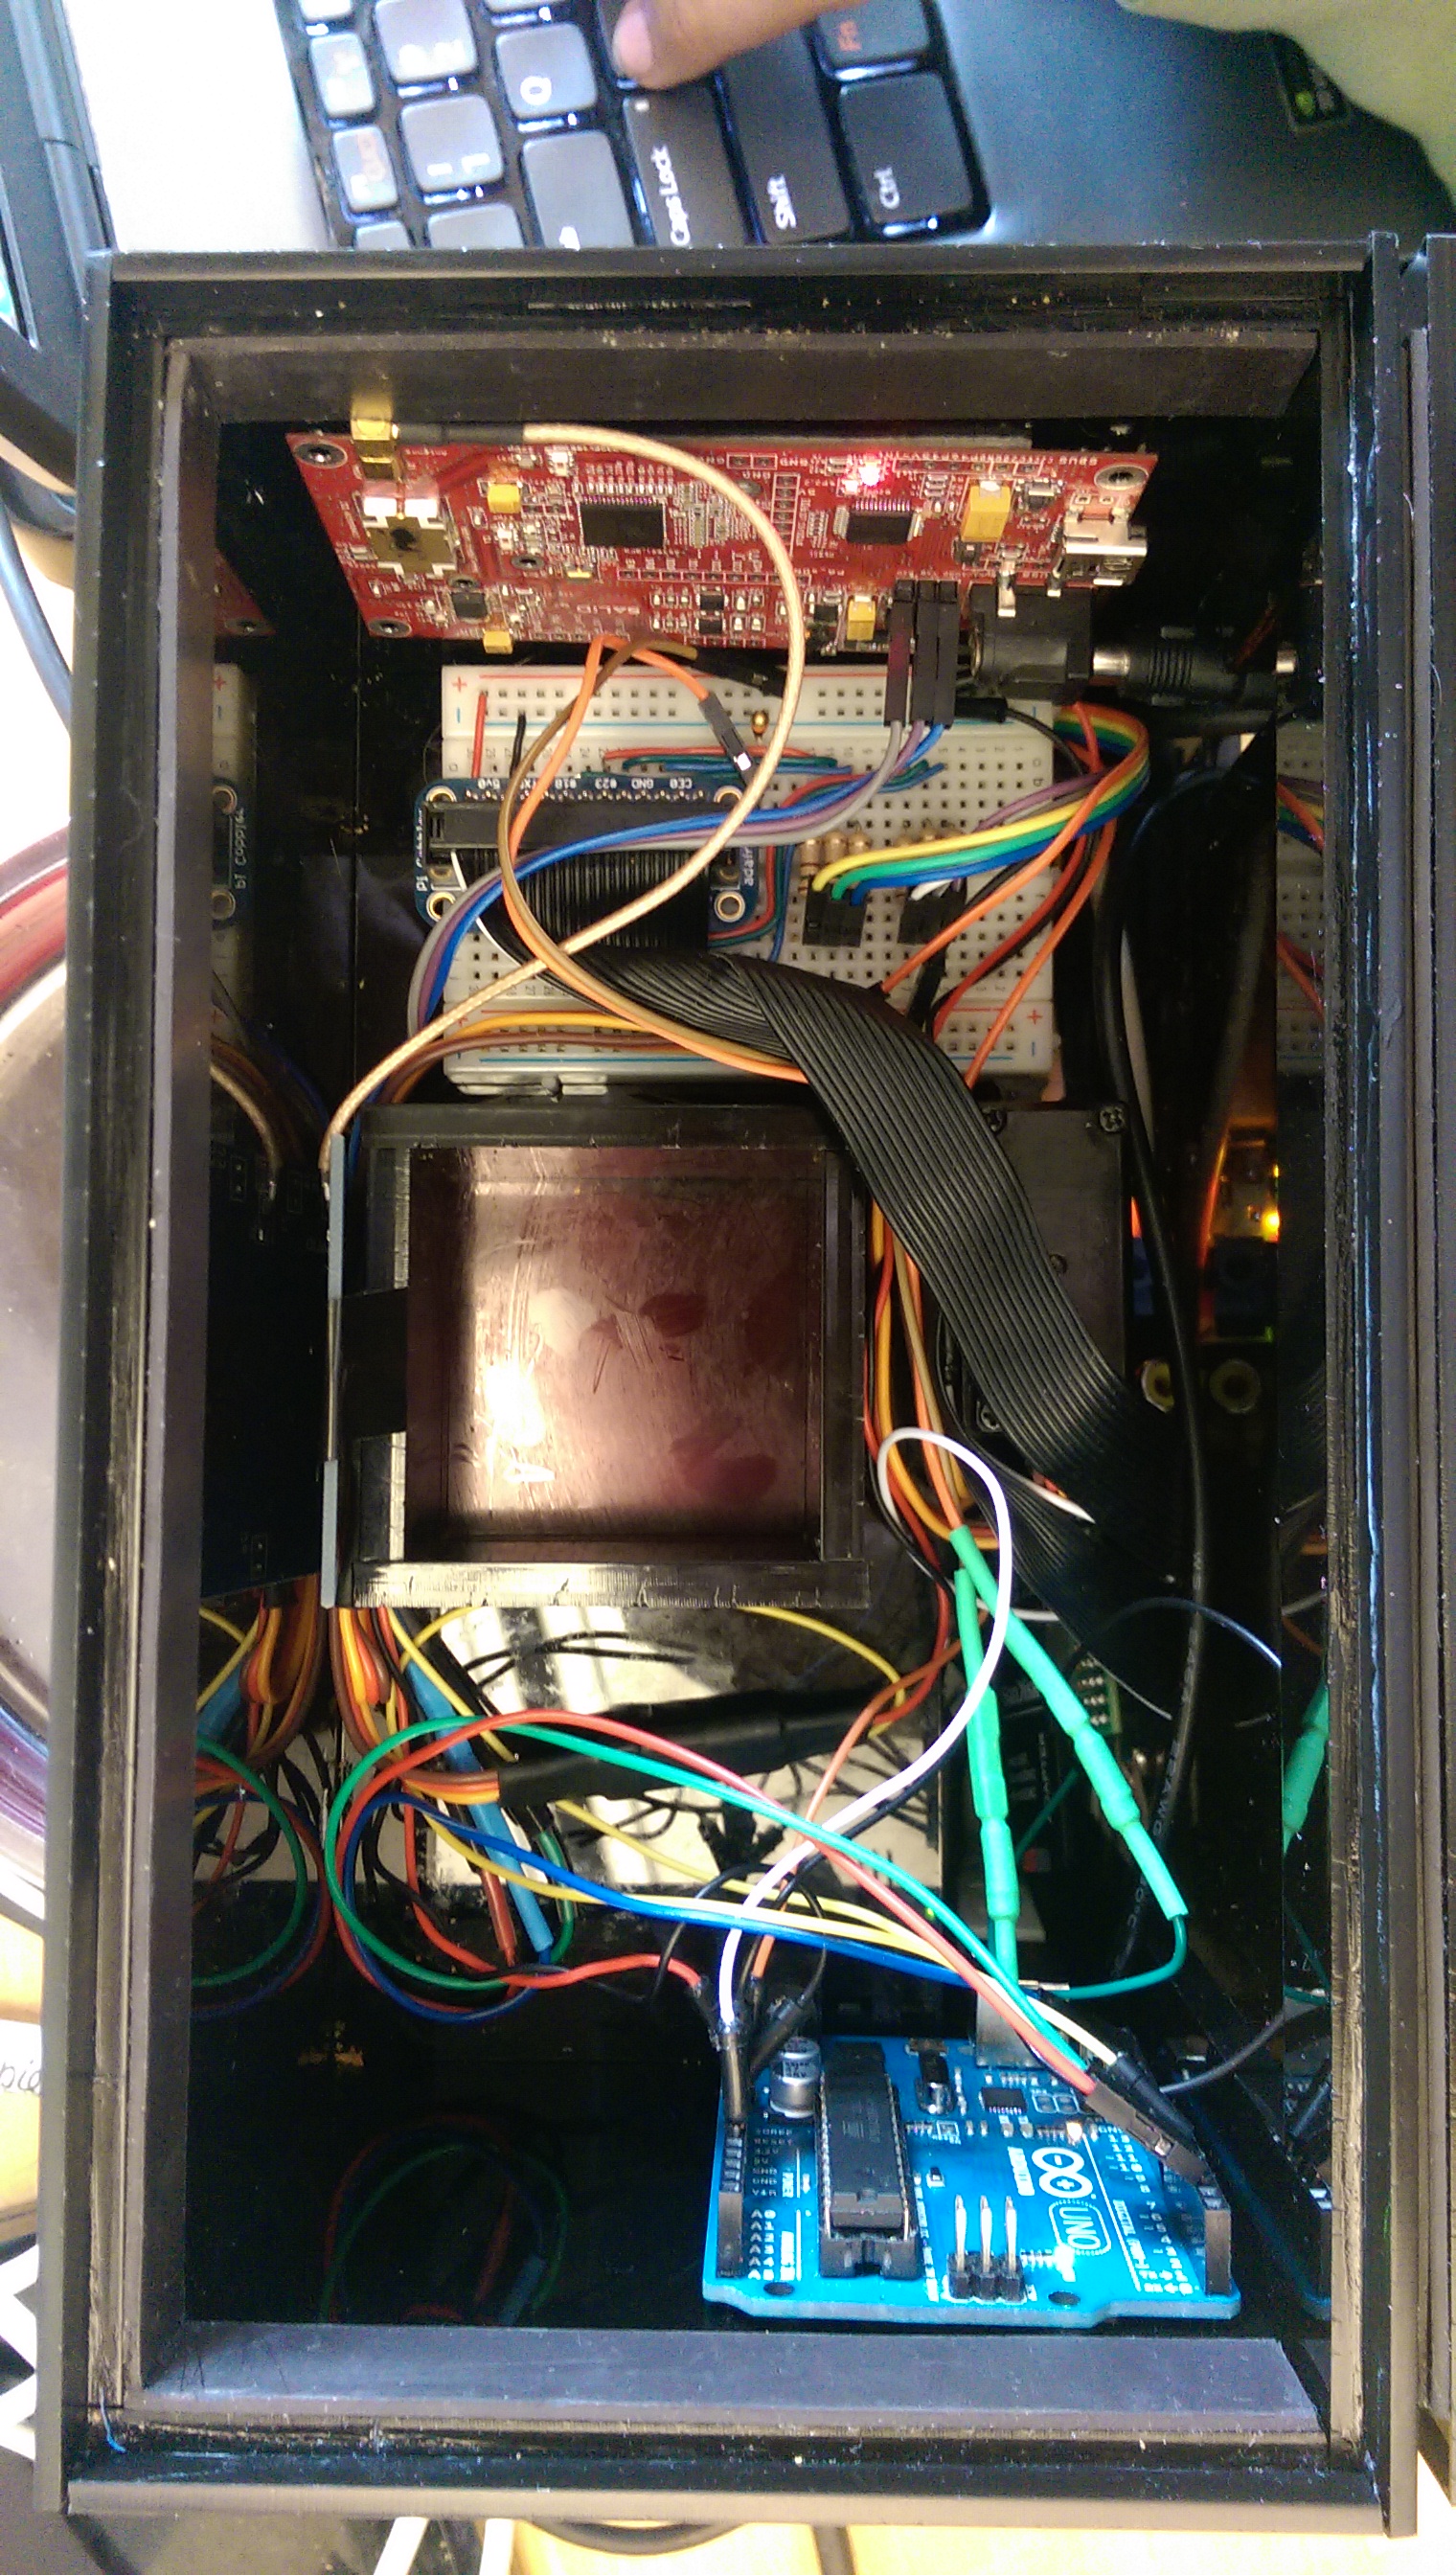
Finally, the finished product.

It uses three networked Raspberry Pis to keep everything in sync, as well as the power supplies/drivers from the disassembled monitors.

LESSONS LEARNED

I learned a lot about polarization; mainly that about half of the films needed to be removed in order for light to pass through the assembly. Plus, this cool little trick with polarized light.

I also learned about safety/how monitors work: Alas! Disaster struck. I accidentally cut one of the ribbons while disassembling a monitor, which resulted in a single vertical stripe of dead pixels. Plus, my front display got smashed a little bit on the way to the gallery show, and made a black splotch.

RELATED WORK

One main body of research highly influenced my design and concept: the work being done at MIT Media Lab’s Camera Culture Group, notably their research in Compressive Light Field Photography, Polarization Fields, and Tensor Displays.

Their work uses a similar assembly of displays to mine, but is focused mainly on producing glasses-free 3D imagery by utilizing Light Fields and directional backlighting.

A few other groups of people have also done work in this field, namely Apple Inc., who has a few related patents — one for a Multilayer Display Device and one for a Multi-Dimensional Desktop environment.

On the industry side of things is PureDepth®, a company that produces MLDs® (Multi Layer Displays™). There isn’t much information in the popular media about them or their products, but it seems like they have a large number of patents and trademarks in the realm (over 90), and mainly produce their two-panel displays for slot and pachinko machines.

Another project from CMU is the Multi-Layered Display with Water Drops, that uses precisely synced water droplets and a projector to illuminate the “screens”.

REFERENCES

Chaudhri, I A, J O Louch, C Hynes, T W Bumgarner, and E S Peyton. 2014. “Multi-Dimensional Desktop.” Google Patents. www.google.com/patents/US8745535.

Lanman, Douglas, Gordon Wetzstein, Matthew Hirsch, Wolfgang Heidrich, and Ramesh Raskar. 2011. “Polarization Fields.” Proceedings of the 2011 SIGGRAPH Asia Conference on – SA ’11 30 (6). New York, New York, USA: ACM Press: 1. doi:10.1145/2024156.2024220.

Prema, Vijay, Gary Roberts, and BC Wuensche. 2006. “3D Visualisation Techniques for Multi-Layer DisplayTM Technology.” IVCNZ, 1–6. www.cs.auckland.ac.nz/~burkhard/Publications/IVCNZ06_PremaRobertsWuensche.pdf.

Wetzstein, Gordon, Douglas Lanman, Wolfgang Heidrich, and Ramesh Raskar. 2011. “Layered 3D.” ACM SIGGRAPH 2011 Papers on – SIGGRAPH ’11 1 (212). New York, New York, USA: ACM Press: 1. doi:10.1145/1964921.1964990.

Wetzstein, Gordon, Douglas Lanman, Matthew Hirsch, and Ramesh Raskar. 2012. “Tensor Displays: Compressive Light Field Synthesis Using Multilayer Displays with Directional Backlighting.” ACM Transactions on …. alumni.media.mit.edu/~dlanman/research/compressivedisplays/papers/Tensor_Displays.pdf.

Barnum, Peter C, and Srinivasa G Narasimhan. 2007. “A Multi-Layered Display with Water Drops.” www.cs.cmu.edu/~ILIM/projects/IL/waterDisplay2/papers/barnum10multi.pdf.

Lanman, Douglas, Matthew Hirsch, Yunhee Kim, and Ramesh Raskar. 2010. “Content-Adaptive Parallax Barriers.” ACM SIGGRAPH Asia 2010 Papers on – SIGGRAPH ASIA ’10 29 (6). New York, New York, USA: ACM Press: 1. doi:10.1145/1866158.1866164.

Mahowald, P H. 2011. “Multilayer Display Device.” Google Patents. www.google.com/patents/US20110175902.

Marwah, Kshitij, Gordon Wetzstein, Yosuke Bando, and Ramesh Raskar. 2013. “Compressive Light Field Photography Using Overcomplete Dictionaries and Optimized Projections.” ACM Transactions on Graphics 32 (4): 1. doi:10.1145/2461912.2461914.

This project was supported in part by funding from the Carnegie Mellon University Frank-Ratchye Fund For Art @ the Frontier.

Activate Yourself

Activate Yourself from Amy Friedman on Vimeo.

FullSizeRender

IMG_1584

IMG_1561

FullSizeRender (1)


CONCEPT/PROCESS:

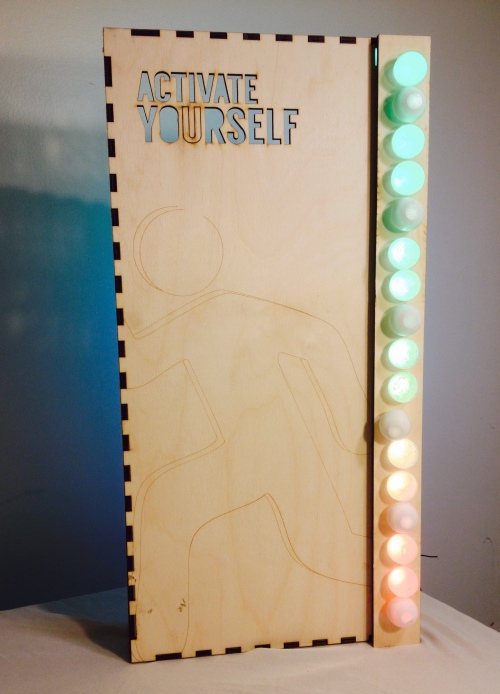
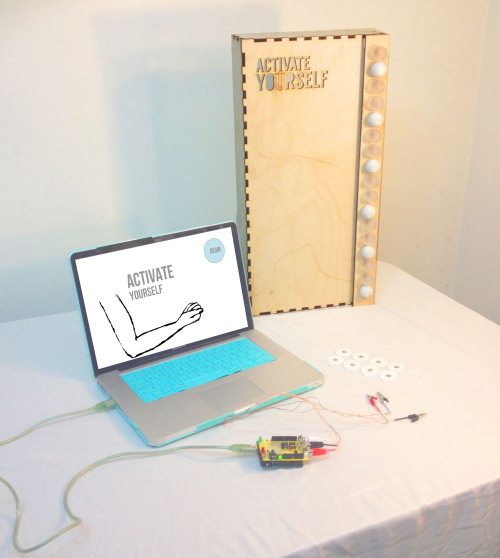
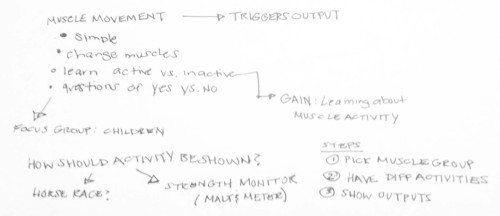
Activate Yourself is a visualization aid, to understand muscle activity. Users follow on screen prompts to visually understand if their muscle of choice is being used during different motions they utilize. This is a being step to better understand our bodies and whether we “activate” ourselves during different activities the way we think we are.

My main interests involve body monitoring, and how information is conveyed to users. Many times we visualize data in a way that not everyone can understand, therefore our experience with data doesn’t add value to our everyday lives to change how we act or inform us about healthy activity. The notion of Muscle Activity can help understanding stroke victims ability to move during rehabilitation, trainers/athletes/kids to understand when they are using the muscles they want, and overall maximize training by understanding if your body is responding the way you believe it to be. Using Processing 2.0 I created the onscreen prompts and software. The software connected to the EMG Shield/Arduino through Firmata imports into Processing, and using the Firmata Code on the Arduino.

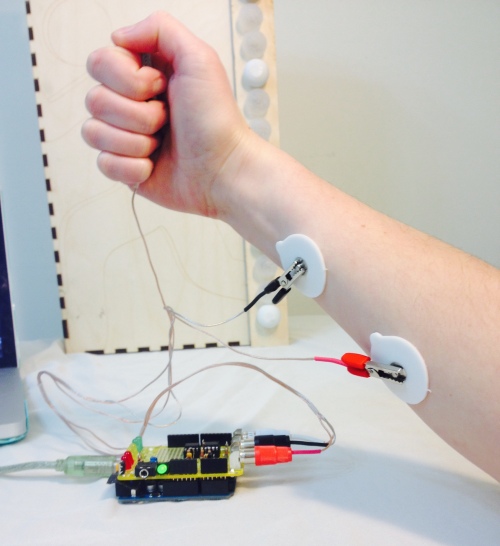
Using the Backyard Brains Electromyogram(EMG) Arduino Shield I was able to retrieve readable data that informed whether a muscle had been “activated” or used which someone was moving. The higher the analog read, the more the muscle was trying to be utilized through local electric muscle activity sent from the brain. I first began by testing out the different Backyard Brains experiments, such as Muscle Action Potentials (measuring the amount of activity), and Muscle Contraction and Fatigue. The latter is what inspired my original path to further understand our bodies.

We currently visualize signals through sin waves, but is there a better way to visualize this information. I then tried to utilize the EMG to detect muscle activity to determine if a muscle is fatigued, not active, active, and rested. This information could optimize working out and lifting. A wearable versatile device that could be worn on any muscle group with haptic or LED feedback would be the idealized version of this project.

I first began by reading how EMGs measure information, can muscle fatigue be recognized, how would I even do this? I read the following articles:

Sakurai, T. ; Toda, M. ; Sakurazawa, S. ; Akita, J. ; Kondo, K. ; Nakamura, Y. “Detection of Muscle Fatigue by the Surface Electromyogram and its Application.” 9th IEEE/ACIS International Conference on Computer and Information Science, 43-47 (2010).

Subasi, A., Kemal Kiymik, M. “Muscle Fatigue Detection in EMG Using Time-Frequency Methods, ICA and Neural Networks”  J Med Syst 34:777-85 (2010).

Reaz, M.B.I., Hussain, M.S., Mohd-Yasin, F. “Techniques of EMG signal analysis: detection, processing, classification and applications.” Biological Procedures Online 8: 11-35 (2006).

Saponas, T.S., Tan, D.S., Morris, D., Turner, J., Landay, J.A. “Making Muscle-Computer Interfaces More Practical.” CHI 2010, Atlanta, Georgia, USA.

I created my own analysis of my data using the procedures in the article:

Allison, G.T., Fujiwara, T. “The relationship between EMG median frequency and low frequency band amplitude changes at different levels of muscle capacity.” Clinical Biomechanics 17 (6):464-469 (July 2002).

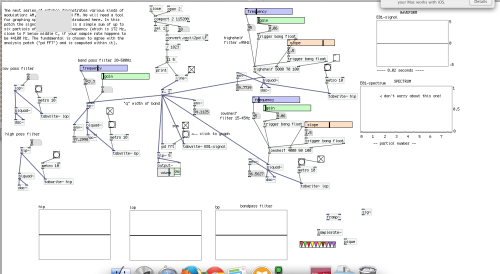
I realized that in order to better understand the data I needed to filter it to get rid of external noise, and compare frequencies using Signal Processing, after filtering the data I could use Machine Learning or Neural Network tools to recognize patterns of fatigued, active, rested or not-active. With the help of Ali Momeni, CmuArtFab Machine Learning Patch and my resources above, I created a patch in Max MSP by filtering the signal from Arduino, but this wasn’t enough to be able to recognize the signal. The sample rate of my data is only 1024 while the samplerate for Audio is 44100Hz making my data very tiny when transformed using the Fast Fourier Transform(FFT) settings in Max MSP. It was recommended that I try to utilize Pd. I was able to filter the data, but as I am not rehearsed in Signal Processing methods it was unclear to me how to go about the next phases to utilize Neural Networks.

Screen Shot 2014-12-16 at 7.43.30 PM

Max Patch


Screen Shot 2014-11-17 at 6.32.19 AM

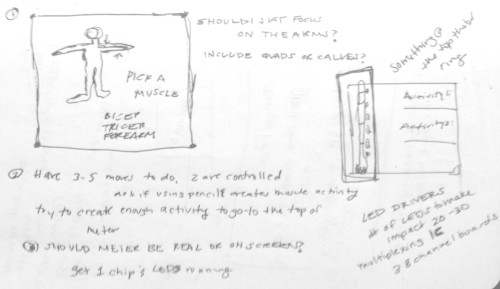
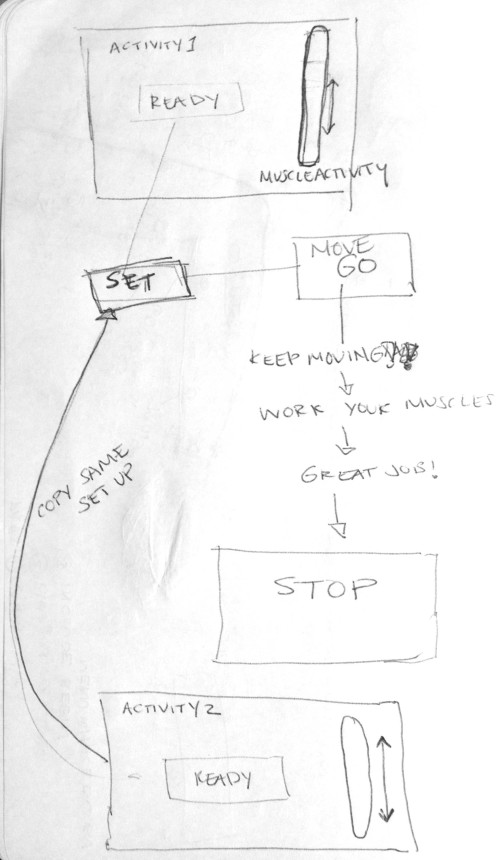
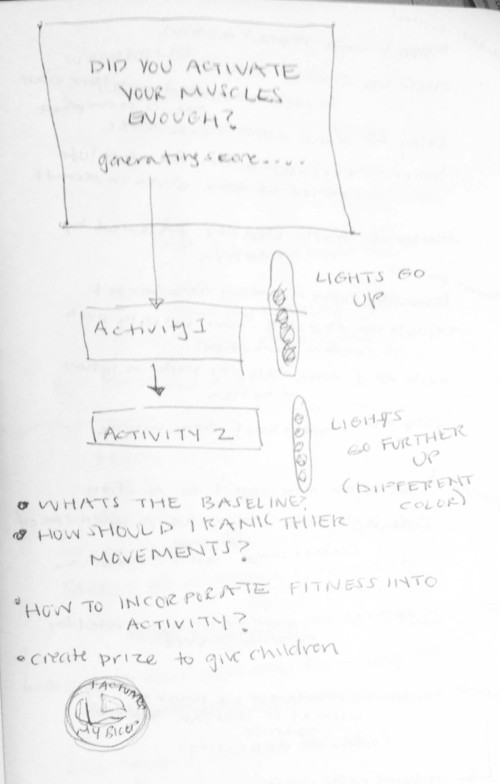
PureData Patch

At this point I refocused my project scope to help visualize muscle activity, or as the Backyard Brains experiment calls this “Muscle Action Potentials”. Using Processing 2.0, I created the “Activate Yourself” software which instructed users how to put on an EMG based muscle choice (the tricep, bicep or forearm), gave them on screen instructions and feedback for each timed activity, while showing their activity levels on a metered display. Creating the software took me time as it was hard to navigate between menus and I had trouble moving words while utilizing a timer. I spent too much time on making this work, that the end “AH HA” moment needed more attention. I spent time sketching out the interactions and how they should experience the timers.

IMG_1546

IMG_1547

IMG_1551 IMG_1552

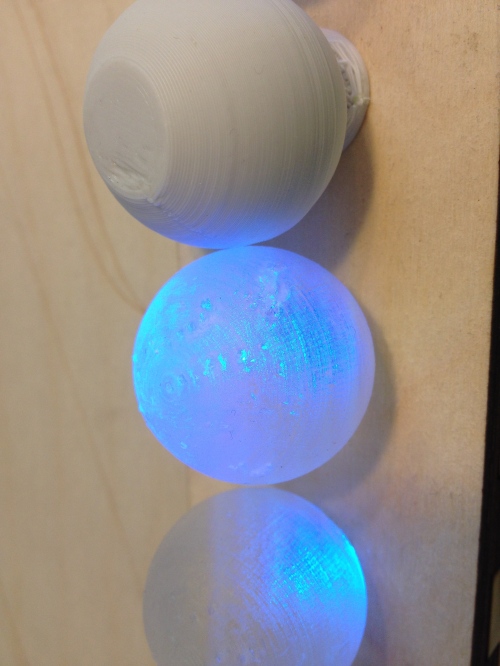
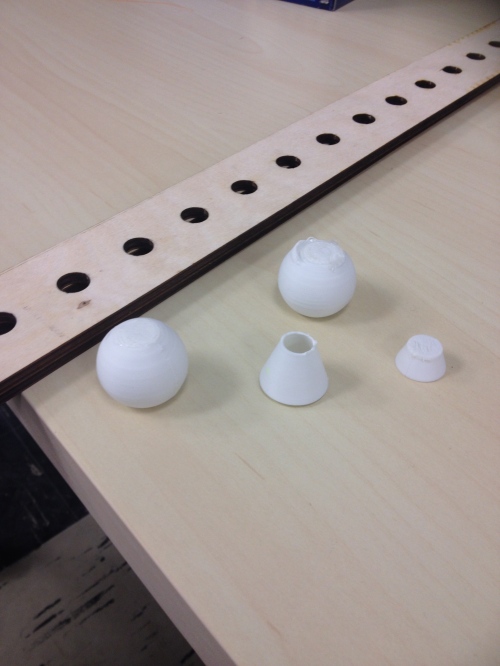
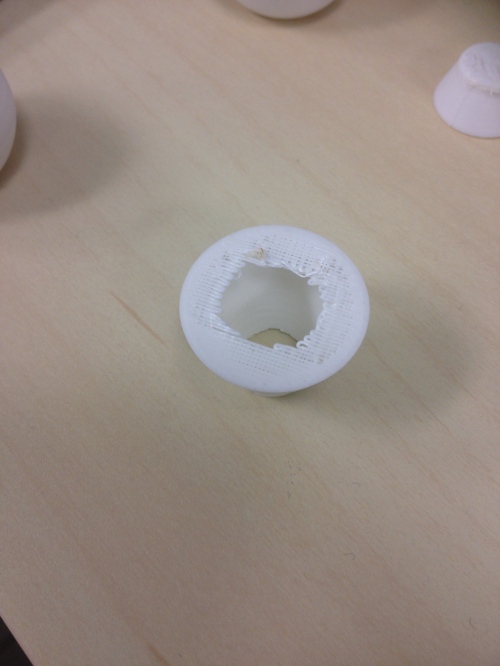
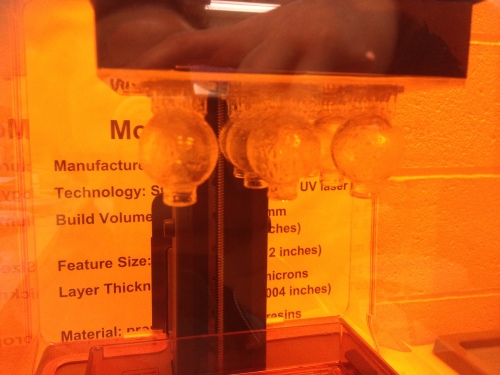
For the Physical Visual Piece, I used Rhino to create a Shadow Box and 3d printed Lightbulbs using the Cube and FormLab printers. The FormLab printer was able to print the bulbs without any issues, while the Cube required supports and the Cubify software doesnt provide this type of additive support options as the PreForm software for Formlabs does. In order to print without supports on the Cube I made the sphere flat at the top, but there were issues with printing the neck of the bulb as there was so support for it to print over/connect to, making that area brittle.

IMG_1508IMG_1509

Tests to create design with Cube

I also learned that you can copy several of the same parts into a print to allow for it to print quicker using a Formlab printer, which sped up the process alot!

IMG_1517

Printing with FormLab Printer

IMG_1504

Printing with Cube

Connecting the NeoPixels to be insync with the Firmata code was hard and I am still figuring this part out better at the moment. I will post when I have this fixed!

LESSONS LEARNED:

1. I have low knowledge in Signal Processing, but it was a good start to my task of learning about wearable technology and has helped me focus on what I need to learn next semester

2. Creating the software took me time as it was hard to navigate between menus and I had trouble moving words while utilizing a timer. I spent too much time on making this work, that the end “AH HA” moment needed more attention.
3. I got to work with Max MSP and PureData which was a great opportunity, and although it was just beginning it was nice to work in both softwares and understand their basic setups better. I was previously overwhelmed by each.

4. Balancing between the physical components and software components was not easy as if one didnt work then you couldnt utilize the other.

RELATED WORK:

Athos – Athos is a wearable fitness shirt that utilizes a six-axis accelerometers, EMG to measure muscle effort, muscle target zones and muscle fatigue. Heart rate and breathing patterns are tracked to further enhance you overall performance, and this device determines your recovery rate to truly maximize your workout.

Mio Link- Heart Monitor with Bluetooth connectivity, acknowledges current training zone by color on the wristband. Images below is off of the Mio Website . It indicates the 5 heart rate zones that are tracked by the heart rate monitor.

Screen Shot 2014-10-26 at 6.14.54 PM

KibbleControl

Kibble Control! This is a pet bowl device that can connect to the internet! Sure, there are other bowls out there. Bowls that detect RFID. Bowls that schedule your cats feeding time. Bowls that connect to the internet and can update you on when your cat ate. Problem is, none of these bowls have the ability to accommodate multiple pets while being able to connect to the internet and allow for the pet owner to control exactly how much the cat should eat each meal and at what time. No other bowl understands whether one pet tends to bully another away from the food bowl and will update the owner over a connected web application. Other bowls that do connect over the internet do so via a phone app, which requires a smart phone to be used, and cannot be accessed via other devices.

Point is, we thought of [almost] everything! It’s a work in progress but we believe we are on to something here. We plan to continue to explore our options regarding this project because it was a lot of fun to work on, it benefits me personally to make this bowl the best it can be so at least I can use it in my home, and there does not seem to be any draw-backs to giving it a go when we have the time for it.

Horay for KibbleControl!

KibbleControl from Yeliz Karadayi on Vimeo.


IMAG0088

opened back

IMAG0089

closed back- locked in with magnets

IMAG0093

the mess inside

img3

img4

img9

img10

img11

img14

RPi-Windows troubleshooting

I recently got tangled into Raspberry Pi – Windows connectivity problems again. Hence, I decided to solve it for once and forever.
I have windows 7. I am running all following steps as admin.

Here is the ultimate fix.

1. Download DHCP Server for Windows here- www.dhcpserver.de/cms/download/

2. Unzip and install dhcpserver.exe

3. Go to properties of your Local Area Network and Assign a static IP. For example- 192.168.2.1. Enter Subnet mask. For example- 255.255.255.0 .

4. Run dhcpwiz.exe from the downloaded folder.

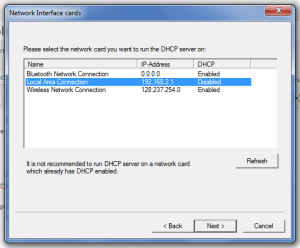
5.Select Local Area Network. It should say ‘Disabled’ . Hit Next.
1

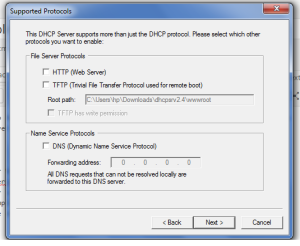
6. Do not do anything on this screen, hit Next.
2

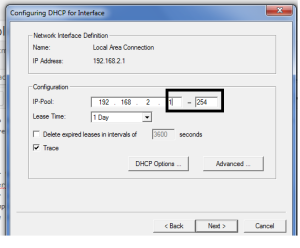
7. Insert a range here(highllighed in the image). for example Put 100-110
3

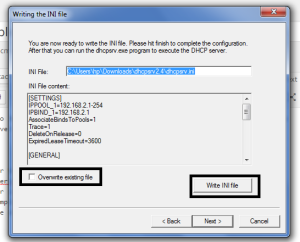
8. check box “Owerwrite previous file” and Write the Configuration file.
you should see “INI file written after this step.”. Hit Next/finish
4

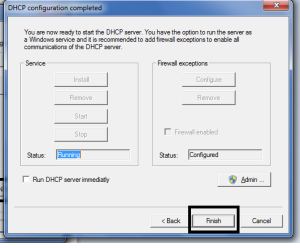
9. Now you should see status as “Running” here. If not, hit Admin.
5

10. That’s it, you are done. On next page of the interface, enable the option “continue running as tray app”.

Now, boot up your RPi, you should see inet address as the one you assigned in the DHCP server.

Hope this helps future MTI folks with windows machine.

Similar video here

Tracking the ISS

Software,Technique — Tags: , , , , , — epicjefferson @ 1:32 pm