Phase

Assignment,Final Project,Submission — Dan Russo @ 3:34 am

phase_4


Phase Preview from Dan Russo on Vimeo.

Concept:

The concept for this project started as an exploration into the physicality of mathematics and geometry.  These are concepts that are largely used, explored, and taught with on screen software environments.  The direct relationship that these operations hold with computation, make an excellent and effective pair.  However, the goal of this project was to take these abstract and more complex processes and bring them into the real world with the same level of interactivity they had on screen.  By combining digital technology with transparent mechanics, exploration could happen in a very engaging and interactive way.


phase_1


Phase:

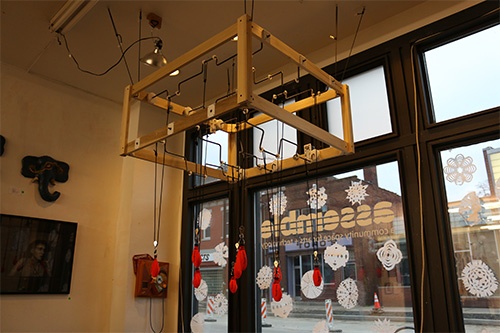
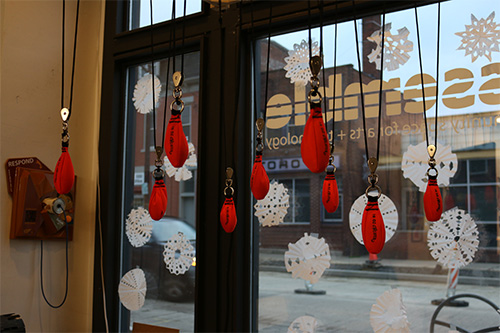
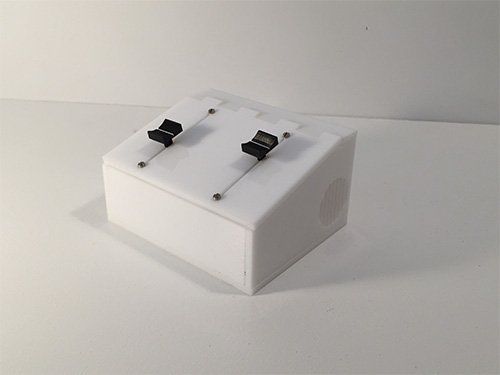
Phase works by mechanically carrying two perpendicular sign waves on top of each other.  When the waves are in sync (frequency) with each other, the translated undulation in the weights below is eliminated.  When the two waves become asynchronous, the undulation becomes more vigorous.  The interaction to this piece is mediated by a simple interface that independently controls the frequency of each wave.  When the sliders are matched, the undulation becomes still, and when they are varied, the undulation becomes apparent.


phase_2

phase_5

phase_3

Related Work:

Rueben Margolin

Reuben Margolin : Kinetic sculpture from Andrew Bates on Vimeo.

Rueben Margolin’s work uses mechanical movement and mathematics to reveal complex phenomena in a fresh accessible way.  The physicality of his installations were the inspiration for this project.  These works set the precedent for beautiful and revealing sculptures,  but the separating goal of phase was to bring an aspect of play and interaction to this type of work.

Mathbox.js

Mathbox is a programming environment for creating math visualizations in web gl.  This environment is an excellent tool for visualizing complex systems.  Phase seeks to take this visual way of explanation and learning, and apply to a physical and tactile experience.


Lessons Learned: (controlling steppers)

Stepper motors are a great way to power movement in a very controlled and accurate way.  However, they can be really tricky to drive and work with.  Below is a simple board I made that can be used to drive two stepper motors on one arduino.  The code is easy to pick up via the accel stepper library, so this board will clear up a lot of the challenging hardware issues so you can get up and running very quickly.

Things you need:

+Pololu Stepper Driver (check to see if you need low or high voltage variant)- see your specific motor’s data sheet.

See Photo Below and Link for Wiring

Planet Wars

Final Project,Submission — Tags: , — priyaganadas @ 1:53 am

The idea of the project is to render fictional world of novel by using playing cards so that the content becomes interactive.
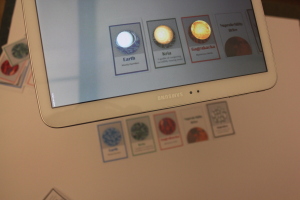
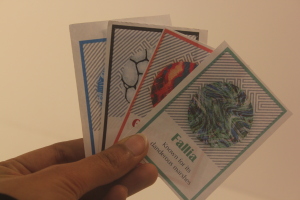
Planet wars is based on famous science fiction novel “Hitchhiker’s guide to the Galaxy” by Douglas Adams. It consists of 28 planet cards that have been described in the novel. Every card has a keyword that describes the key character of the planet or the people who live on the planet.

How to Play-
Two or more players shuffle and distribute the cards among themselves. Using the planet set that each player has they are supposed to create a story of how their planet would defeat opponent’s planet. This argument has to be counter argued by the opposite player. Whoever builds a better story wins.
How to see the fictional part and interact with the story-
These cards are put below a tablet which has a custom made application.
Cards have the artist’s rendering of the fictional world. The winner of the round gets to tap on the 3D render of opponent’s planet and blast it.
Once the planet is blasted, it is dead and the card can be used anymore. the augmented object is not seen anymore.

IMG_0668

IMG_0683

IMG_0684

Steps-
I tried multiple things before arriving at the final project described above. I think it’s important that I describe all the steps and learnings here-

1. I started with this idea of data sonification of an astronomy dataset. I looked at various dataets online and parsed a dataset of planet set and rise time from pittsburgh for a week, within pure data. After this step, I realised that I need to move to max msp in order to create better sound and more control on data.

2. I started working with max msp, I set up max with ableton and kinect so that body gestures of a human skeleton can be tracked. This is the video demo of music generated when a person moves infront of kinect.
The music is currently changing in relation to hand movement.

3. After this step, I dived deep into finding the correct dataset for sonification. I came across following video and I read more about deep field image taken by hubble telescope over ten days.

Every dot in this image is a galaxy.
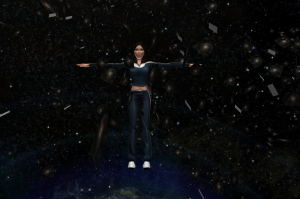
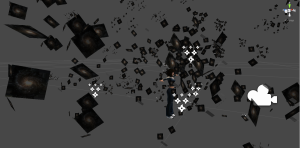
I was inspired by this image and I decided to recreate the dataset inside unity. Aim was to build the deep field image world in unity and using kinect to give the ability to move through this simulation.

Here is how it looks

Screen Shot 2014-12-17 at 5.14.47 PM

Screen Shot 2014-12-17 at 5.20.28 PM

4. I got feedback from the review that the simulation wasn’t interactive enough. Also, there wasn’t enough user experience and immersion. We also happened to visit the galley space where the final exhibit was going to take place. All of this made me realise that I should use all the skills I learned till this point of time to create something fun and playful. That’s when I thought about developing Planet Wars.

Learning
1. I learned to parse dataset in pure data and work with sounds
2. I got introduced to Max and ableton and made my first project work on both of these platforms.
3.The technology used for the final project is- Unity 3D game engine.
Leanings- I learned to render 3D objects inside unity. I learned to add shaders and textures on objects. I also wanted to be able to create particle systems which was part of creating the explosion animation/special effect. I learned how to make my own ‘prefab’, quality or set of features applied to an object that can be repeated for other objects inside unity. Also, I learned how to add gestural interactions like tapping on virtual objects to andriod apps developed in Unity. I worked with getting 3D sounds attached to explosions so that the sound is different depending on whether the user is near or far from the virtual object.

References and related work
1. Astronomy Datasets- Astrostatistics, NASA dataset
2. SynapseKinect
3. Crater project
4. LHC sounds
5. Data sonification

Ahead
From the feedback I received, I am planning to add more special effects during planet interactions and also more 3D objects than just planets- The spaceship and different artifacts used in the novel.

LAYERd

Assignment,Final Project,Hardware,Software — Tags: — John Mars @ 10:45 pm

LAYERd is a multi-layer display made from off-the shelf computer monitors. It allows for glasses-free 3D as well as a novel way to envision User Interfaces.

Every LCD screen on the planet is made of two main parts: a transparent assembly (made of laminated glass, liquid crystal, and polarizing filters) and a backlight. Without the backlight, an LCD monitor is actually completely transparent wherever a white pixel is drawn.

LAYERd uses three of these LCD assemblies illuminated by a single backlight to create a screen with real depth: objects drawn on the front display are physically in front of objects drawn on the rear ones.

My work is mainly focused on the potential UI uses for such a display: what can one do with discrete physical layers in space?

PROCESS

The process begins by disassembling the three monitors. After destroying two cheaper ones with static electricity before the project began in earnest, I was very careful to keep the delicate electronics grounded at all times, and I worked on top of an anti-static mat and used an anti-static wristband when possible.


With some careful prying, the whole thing came undone.


Here, you can see how the glass panel is transparent, and how the backlight illuminates it.

After disassembly came the design, laser cutting, and assembly of the frames and display.

Finally, the finished product.

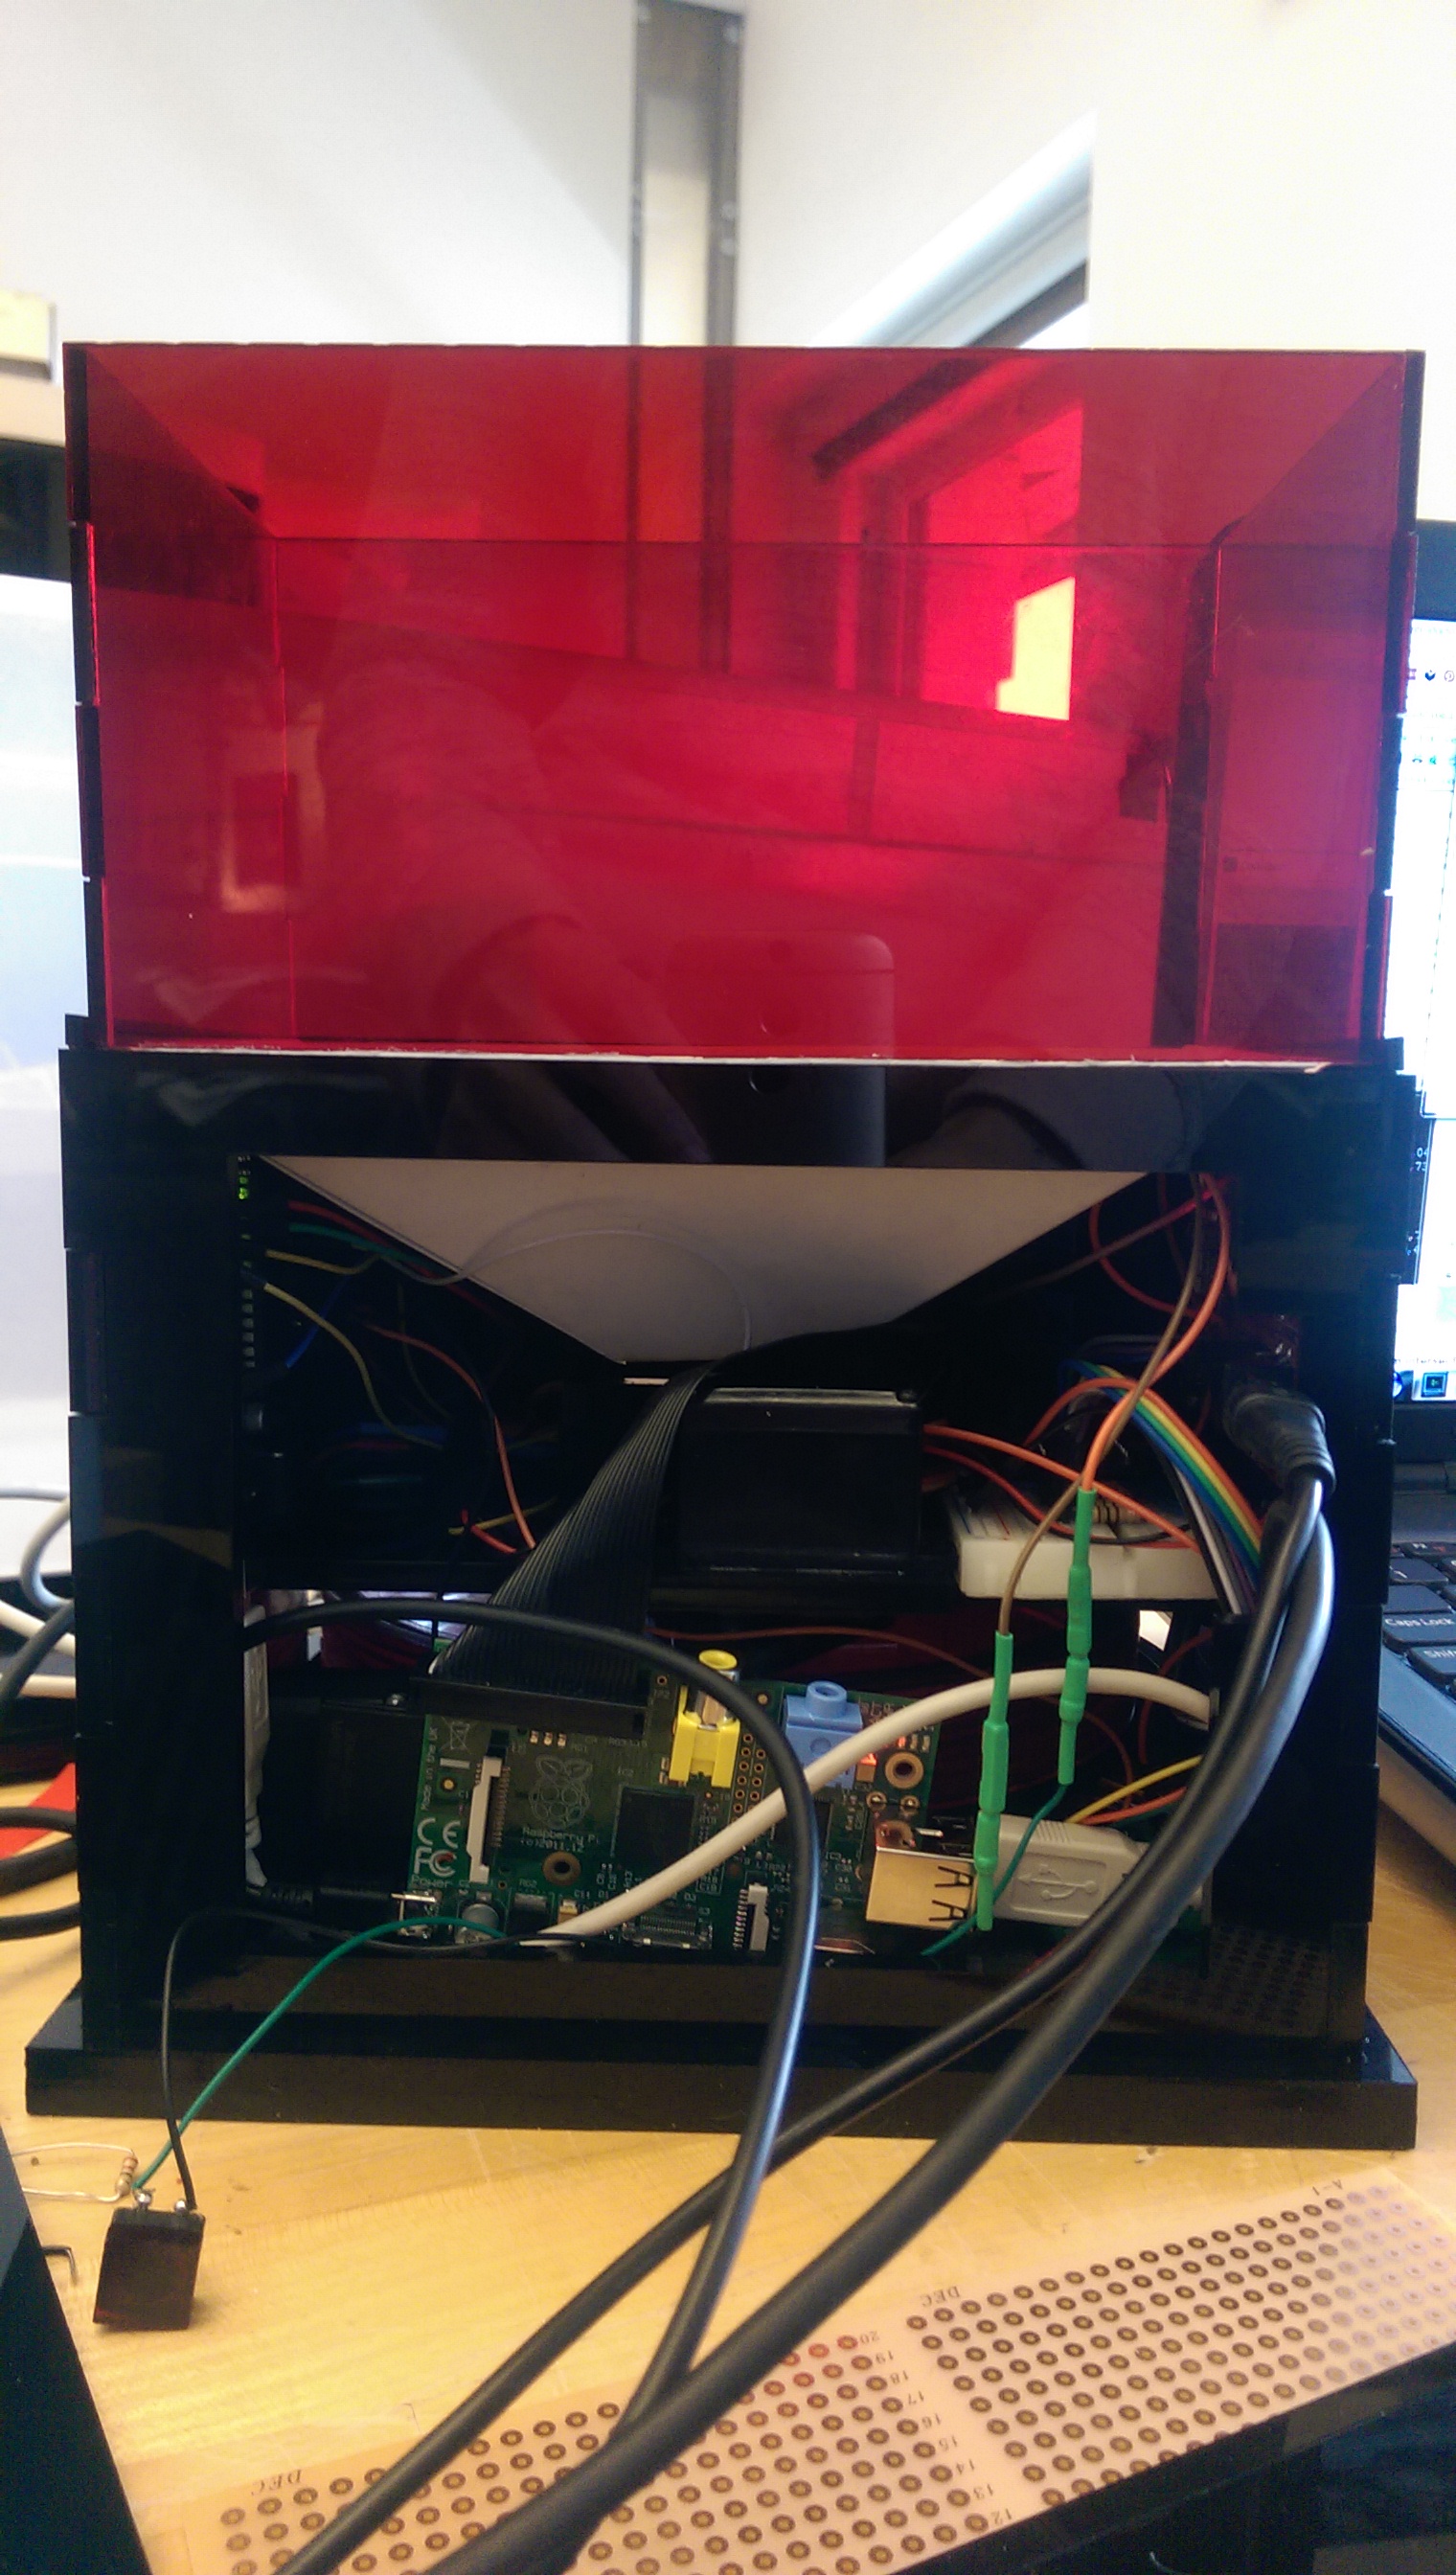
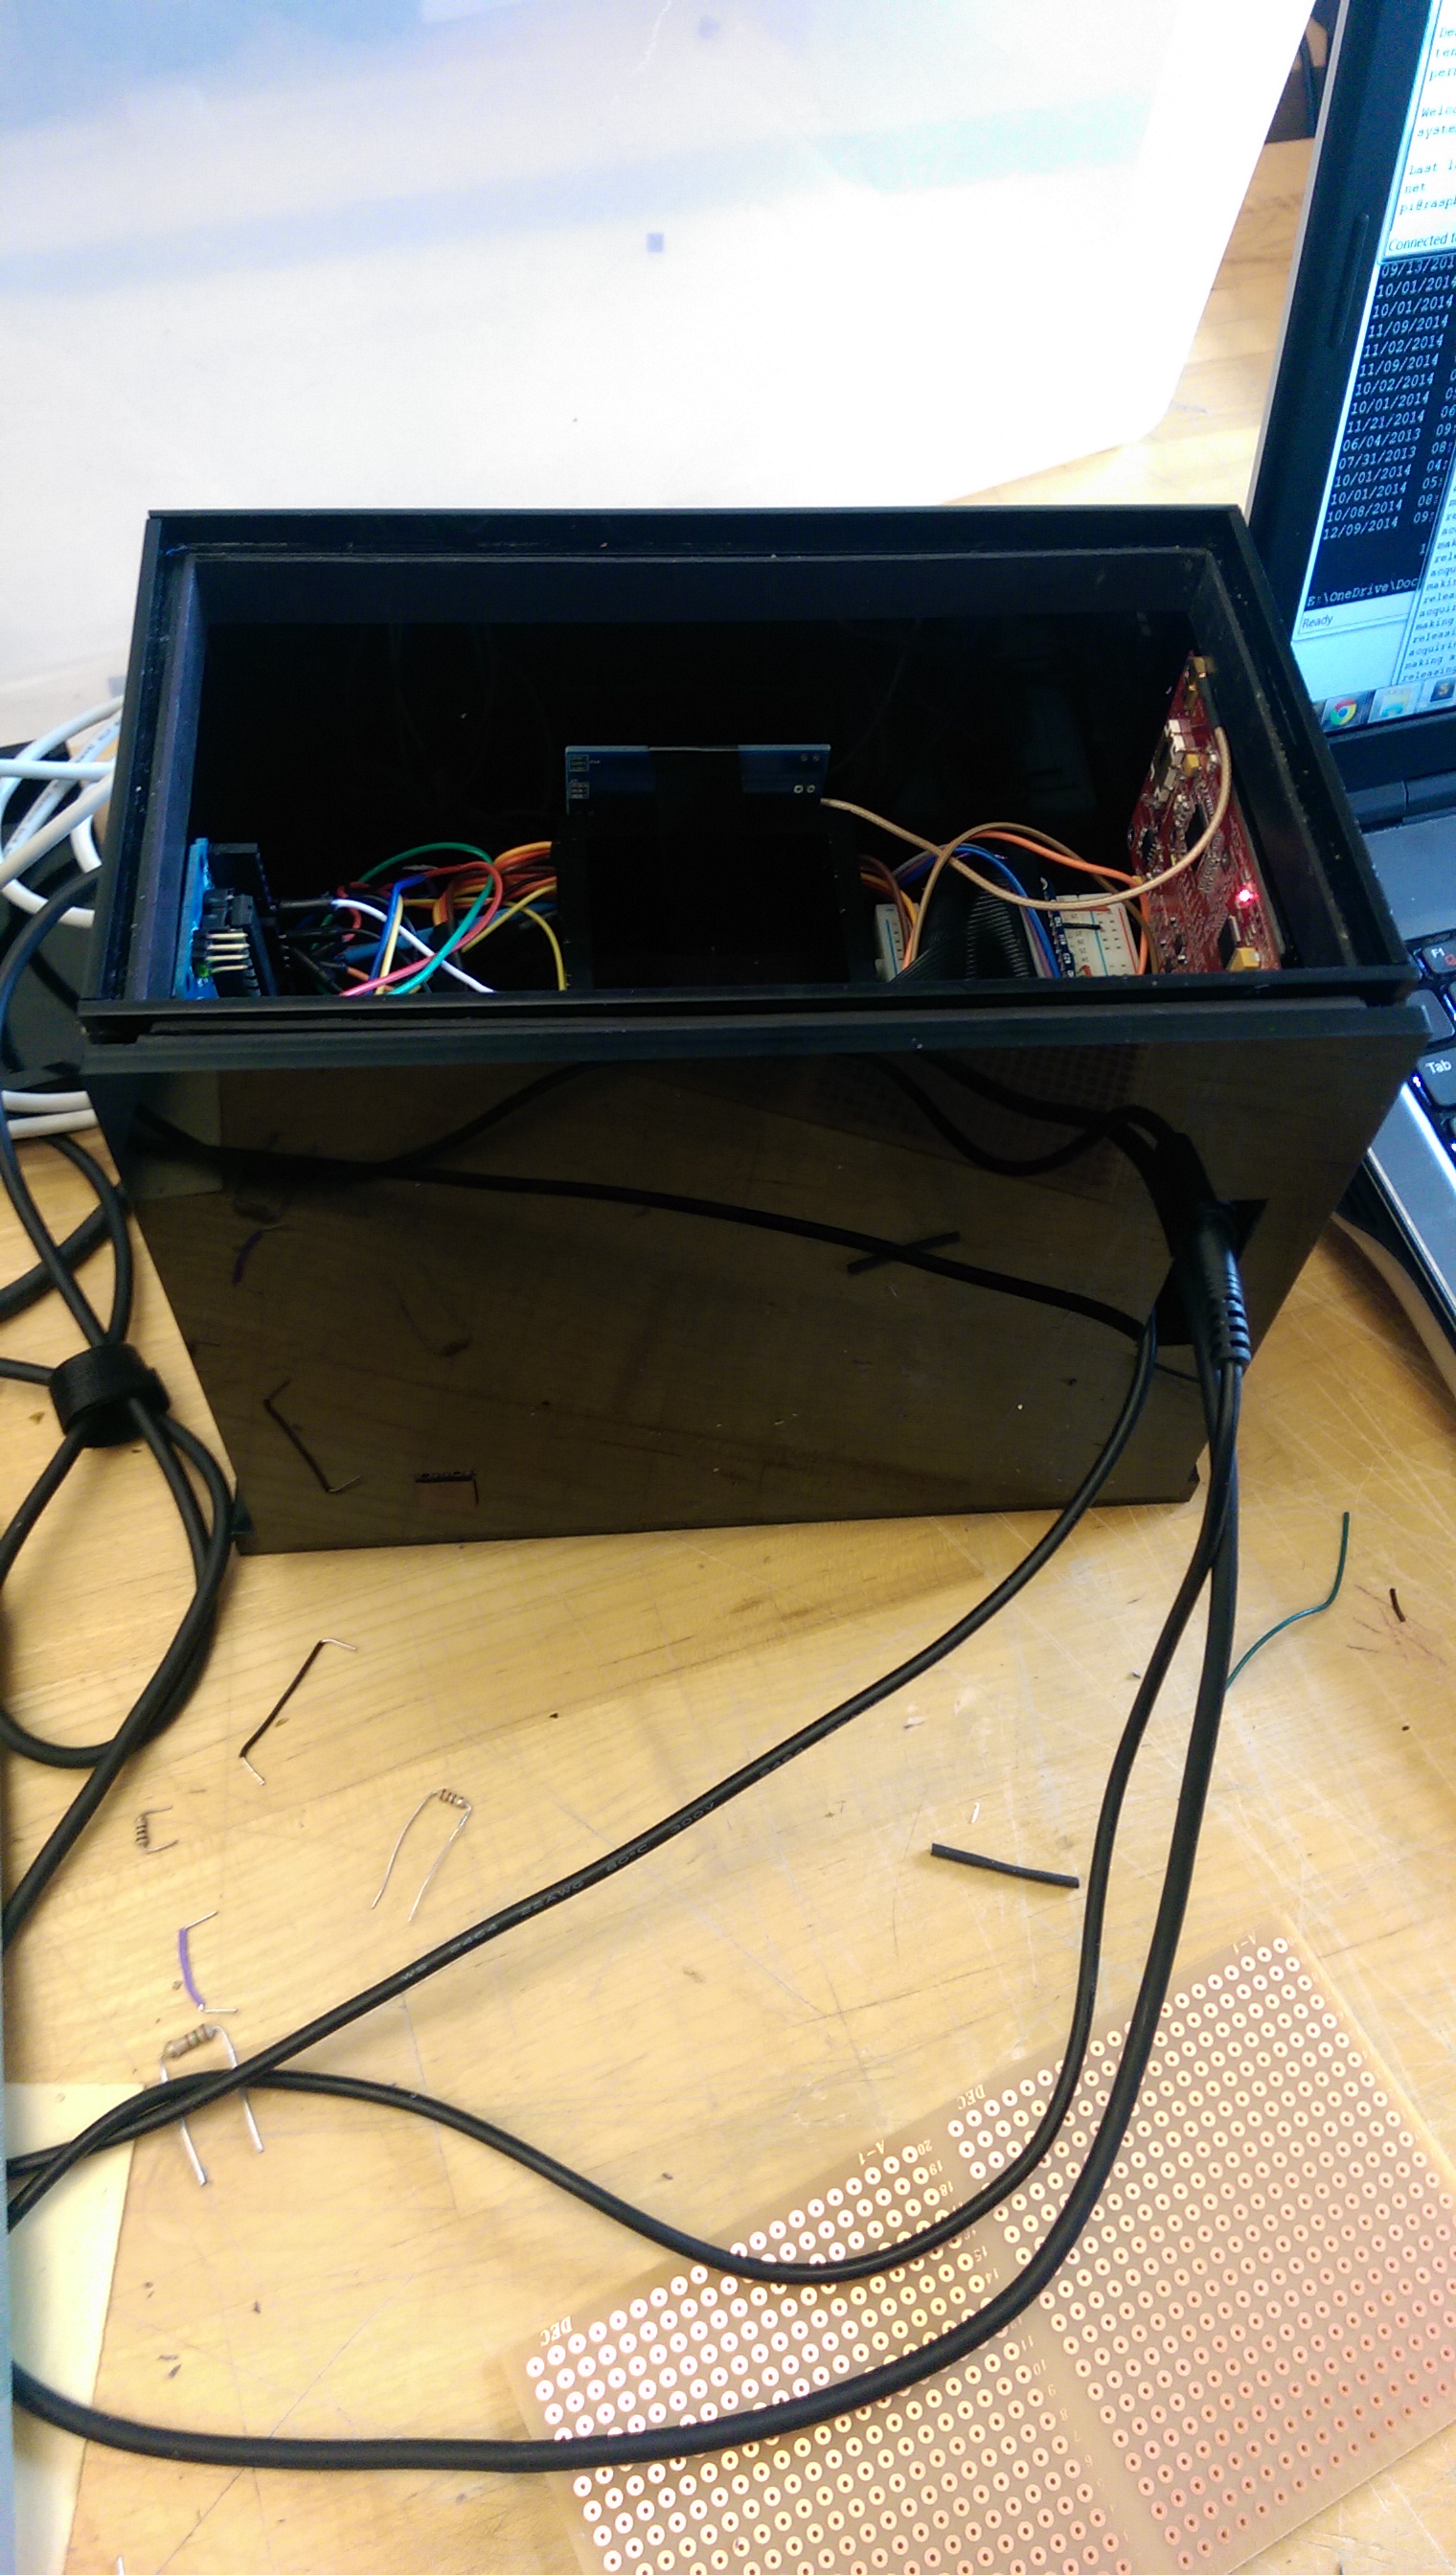
It uses three networked Raspberry Pis to keep everything in sync, as well as the power supplies/drivers from the disassembled monitors.

LESSONS LEARNED

I learned a lot about polarization; mainly that about half of the films needed to be removed in order for light to pass through the assembly. Plus, this cool little trick with polarized light.

I also learned about safety/how monitors work: Alas! Disaster struck. I accidentally cut one of the ribbons while disassembling a monitor, which resulted in a single vertical stripe of dead pixels. Plus, my front display got smashed a little bit on the way to the gallery show, and made a black splotch.

RELATED WORK

One main body of research highly influenced my design and concept: the work being done at MIT Media Lab’s Camera Culture Group, notably their research in Compressive Light Field Photography, Polarization Fields, and Tensor Displays.

Their work uses a similar assembly of displays to mine, but is focused mainly on producing glasses-free 3D imagery by utilizing Light Fields and directional backlighting.

A few other groups of people have also done work in this field, namely Apple Inc., who has a few related patents — one for a Multilayer Display Device and one for a Multi-Dimensional Desktop environment.

On the industry side of things is PureDepth®, a company that produces MLDs® (Multi Layer Displays™). There isn’t much information in the popular media about them or their products, but it seems like they have a large number of patents and trademarks in the realm (over 90), and mainly produce their two-panel displays for slot and pachinko machines.

Another project from CMU is the Multi-Layered Display with Water Drops, that uses precisely synced water droplets and a projector to illuminate the “screens”.

REFERENCES

Chaudhri, I A, J O Louch, C Hynes, T W Bumgarner, and E S Peyton. 2014. “Multi-Dimensional Desktop.” Google Patents. www.google.com/patents/US8745535.

Lanman, Douglas, Gordon Wetzstein, Matthew Hirsch, Wolfgang Heidrich, and Ramesh Raskar. 2011. “Polarization Fields.” Proceedings of the 2011 SIGGRAPH Asia Conference on – SA ’11 30 (6). New York, New York, USA: ACM Press: 1. doi:10.1145/2024156.2024220.

Prema, Vijay, Gary Roberts, and BC Wuensche. 2006. “3D Visualisation Techniques for Multi-Layer DisplayTM Technology.” IVCNZ, 1–6. www.cs.auckland.ac.nz/~burkhard/Publications/IVCNZ06_PremaRobertsWuensche.pdf.

Wetzstein, Gordon, Douglas Lanman, Wolfgang Heidrich, and Ramesh Raskar. 2011. “Layered 3D.” ACM SIGGRAPH 2011 Papers on – SIGGRAPH ’11 1 (212). New York, New York, USA: ACM Press: 1. doi:10.1145/1964921.1964990.

Wetzstein, Gordon, Douglas Lanman, Matthew Hirsch, and Ramesh Raskar. 2012. “Tensor Displays: Compressive Light Field Synthesis Using Multilayer Displays with Directional Backlighting.” ACM Transactions on …. alumni.media.mit.edu/~dlanman/research/compressivedisplays/papers/Tensor_Displays.pdf.

Barnum, Peter C, and Srinivasa G Narasimhan. 2007. “A Multi-Layered Display with Water Drops.” www.cs.cmu.edu/~ILIM/projects/IL/waterDisplay2/papers/barnum10multi.pdf.

Lanman, Douglas, Matthew Hirsch, Yunhee Kim, and Ramesh Raskar. 2010. “Content-Adaptive Parallax Barriers.” ACM SIGGRAPH Asia 2010 Papers on – SIGGRAPH ASIA ’10 29 (6). New York, New York, USA: ACM Press: 1. doi:10.1145/1866158.1866164.

Mahowald, P H. 2011. “Multilayer Display Device.” Google Patents. www.google.com/patents/US20110175902.

Marwah, Kshitij, Gordon Wetzstein, Yosuke Bando, and Ramesh Raskar. 2013. “Compressive Light Field Photography Using Overcomplete Dictionaries and Optimized Projections.” ACM Transactions on Graphics 32 (4): 1. doi:10.1145/2461912.2461914.

This project was supported in part by funding from the Carnegie Mellon University Frank-Ratchye Fund For Art @ the Frontier.

Activate Yourself

Activate Yourself from Amy Friedman on Vimeo.
FullSizeRender

IMG_1584

IMG_1561

FullSizeRender (1)


CONCEPT/PROCESS:

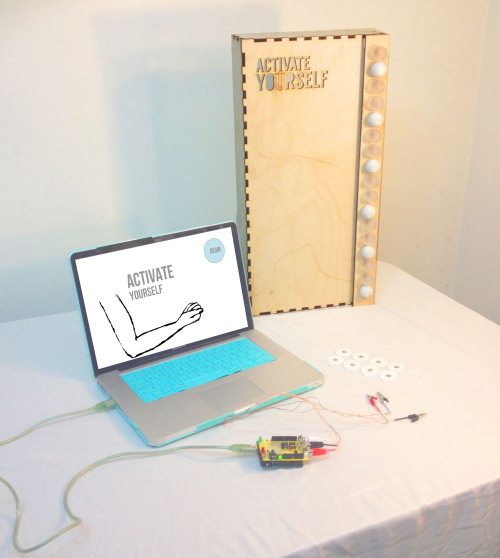
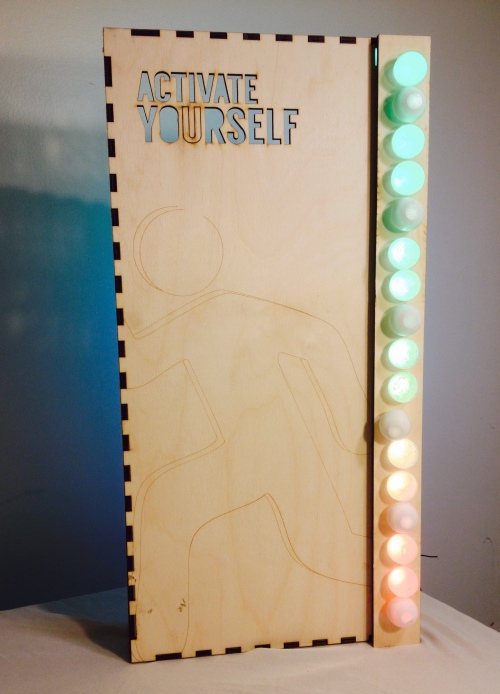
Activate Yourself is a visualization aid, to understand muscle activity. Users follow on screen prompts to visually understand if their muscle of choice is being used during different motions they utilize. This is a being step to better understand our bodies and whether we “activate” ourselves during different activities the way we think we are.

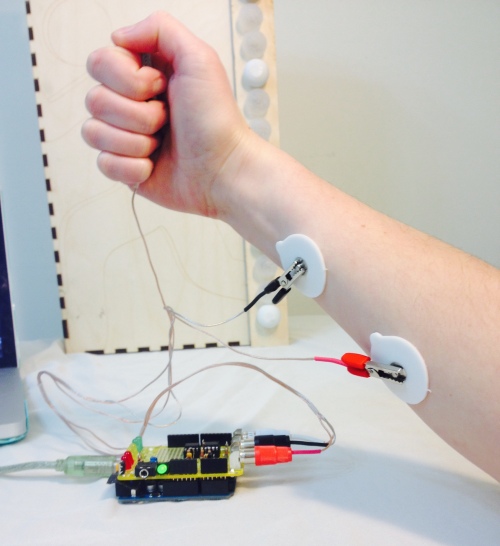
My main interests involve body monitoring, and how information is conveyed to users. Many times we visualize data in a way that not everyone can understand, therefore our experience with data doesn’t add value to our everyday lives to change how we act or inform us about healthy activity. The notion of Muscle Activity can help understanding stroke victims ability to move during rehabilitation, trainers/athletes/kids to understand when they are using the muscles they want, and overall maximize training by understanding if your body is responding the way you believe it to be. Using Processing 2.0 I created the onscreen prompts and software. The software connected to the EMG Shield/Arduino through Firmata imports into Processing, and using the Firmata Code on the Arduino.

Using the Backyard Brains Electromyogram(EMG) Arduino Shield I was able to retrieve readable data that informed whether a muscle had been “activated” or used which someone was moving. The higher the analog read, the more the muscle was trying to be utilized through local electric muscle activity sent from the brain. I first began by testing out the different Backyard Brains experiments, such as Muscle Action Potentials (measuring the amount of activity), and Muscle Contraction and Fatigue. The latter is what inspired my original path to further understand our bodies.

We currently visualize signals through sin waves, but is there a better way to visualize this information. I then tried to utilize the EMG to detect muscle activity to determine if a muscle is fatigued, not active, active, and rested. This information could optimize working out and lifting. A wearable versatile device that could be worn on any muscle group with haptic or LED feedback would be the idealized version of this project.

I first began by reading how EMGs measure information, can muscle fatigue be recognized, how would I even do this? I read the following articles:

Sakurai, T. ; Toda, M. ; Sakurazawa, S. ; Akita, J. ; Kondo, K. ; Nakamura, Y. “Detection of Muscle Fatigue by the Surface Electromyogram and its Application.” 9th IEEE/ACIS International Conference on Computer and Information Science, 43-47 (2010).

Subasi, A., Kemal Kiymik, M. “Muscle Fatigue Detection in EMG Using Time-Frequency Methods, ICA and Neural Networks”  J Med Syst 34:777-85 (2010).

Reaz, M.B.I., Hussain, M.S., Mohd-Yasin, F. “Techniques of EMG signal analysis: detection, processing, classification and applications.” Biological Procedures Online 8: 11-35 (2006).

Saponas, T.S., Tan, D.S., Morris, D., Turner, J., Landay, J.A. “Making Muscle-Computer Interfaces More Practical.” CHI 2010, Atlanta, Georgia, USA.

I created my own analysis of my data using the procedures in the article:

Allison, G.T., Fujiwara, T. “The relationship between EMG median frequency and low frequency band amplitude changes at different levels of muscle capacity.” Clinical Biomechanics 17 (6):464-469 (July 2002).

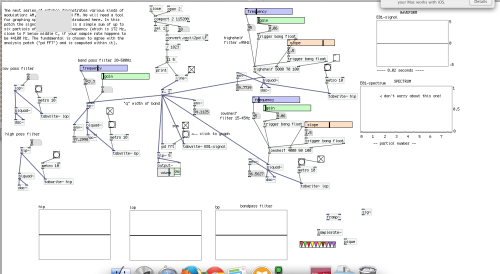
I realized that in order to better understand the data I needed to filter it to get rid of external noise, and compare frequencies using Signal Processing, after filtering the data I could use Machine Learning or Neural Network tools to recognize patterns of fatigued, active, rested or not-active. With the help of Ali Momeni, CmuArtFab Machine Learning Patch and my resources above, I created a patch in Max MSP by filtering the signal from Arduino, but this wasn’t enough to be able to recognize the signal. The sample rate of my data is only 1024 while the samplerate for Audio is 44100Hz making my data very tiny when transformed using the Fast Fourier Transform(FFT) settings in Max MSP. It was recommended that I try to utilize Pd. I was able to filter the data, but as I am not rehearsed in Signal Processing methods it was unclear to me how to go about the next phases to utilize Neural Networks.

Screen Shot 2014-12-16 at 7.43.30 PM

Max Patch


Screen Shot 2014-11-17 at 6.32.19 AM

PureData Patch

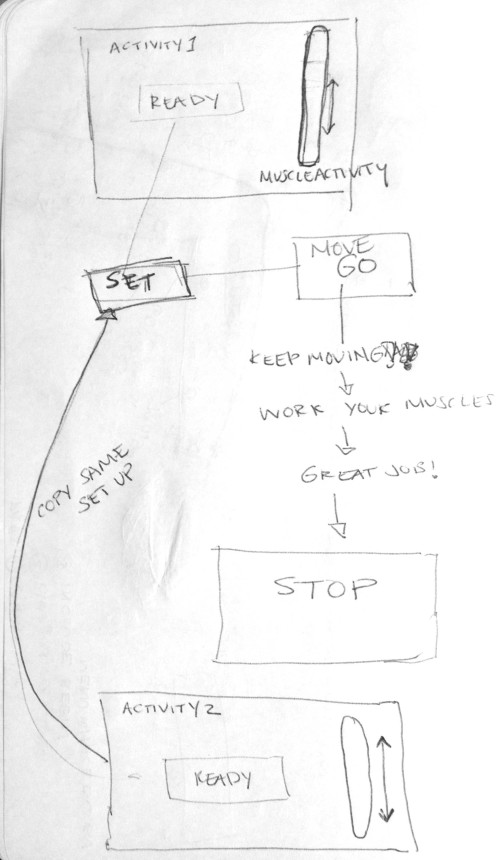
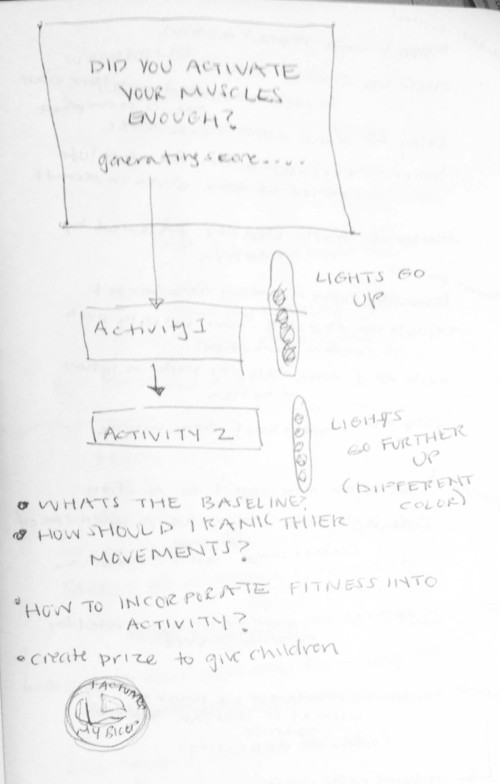
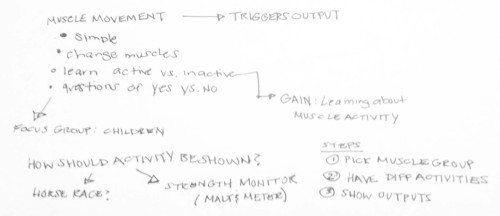
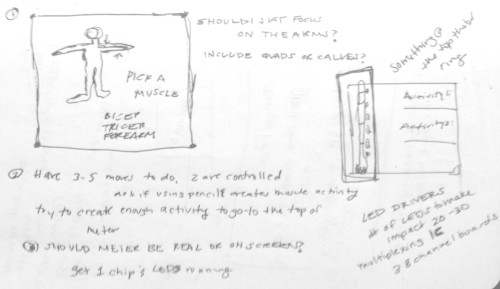
At this point I refocused my project scope to help visualize muscle activity, or as the Backyard Brains experiment calls this “Muscle Action Potentials”. Using Processing 2.0, I created the “Activate Yourself” software which instructed users how to put on an EMG based muscle choice (the tricep, bicep or forearm), gave them on screen instructions and feedback for each timed activity, while showing their activity levels on a metered display. Creating the software took me time as it was hard to navigate between menus and I had trouble moving words while utilizing a timer. I spent too much time on making this work, that the end “AH HA” moment needed more attention. I spent time sketching out the interactions and how they should experience the timers.
IMG_1546

IMG_1547

IMG_1551 IMG_1552

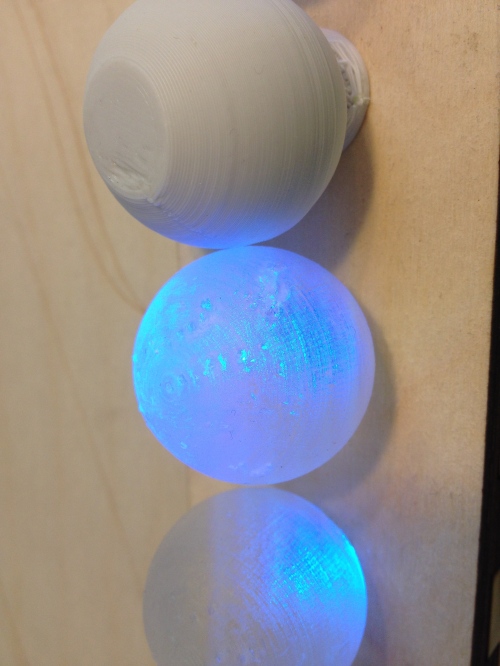
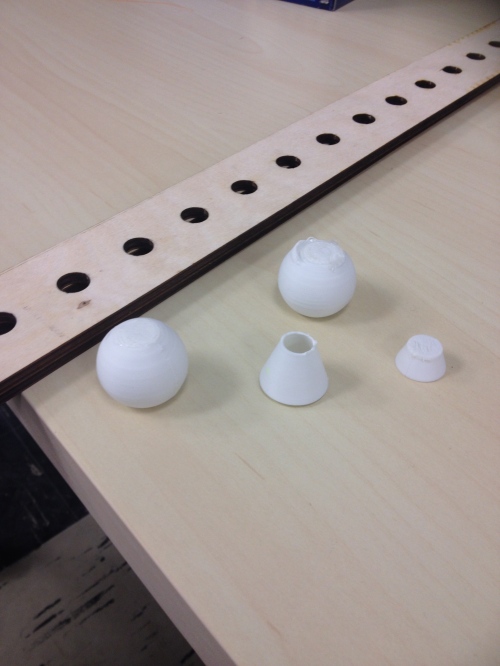
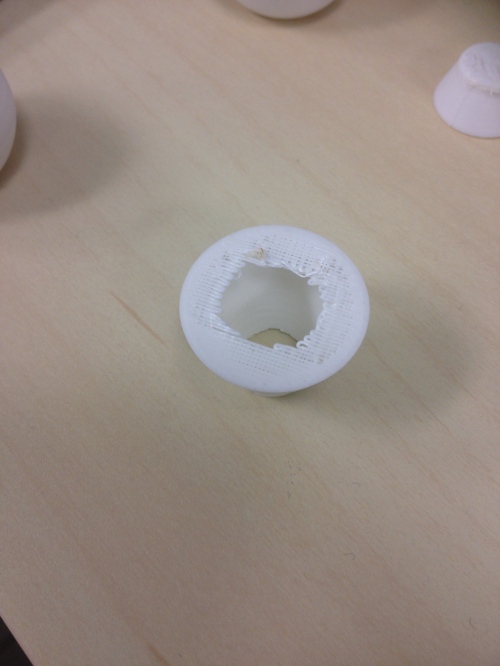
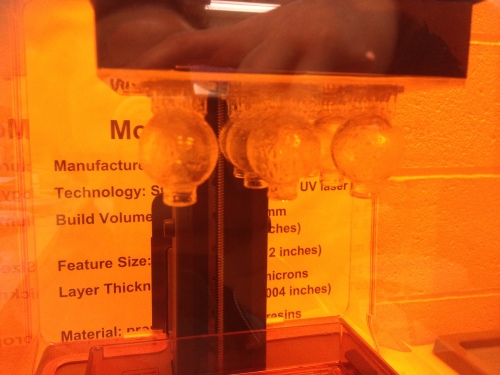
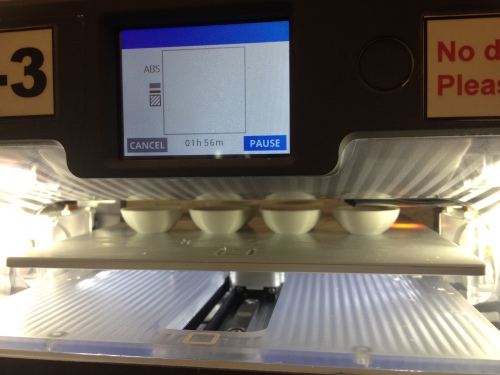
For the Physical Visual Piece, I used Rhino to create a Shadow Box and 3d printed Lightbulbs using the Cube and FormLab printers. The FormLab printer was able to print the bulbs without any issues, while the Cube required supports and the Cubify software doesnt provide this type of additive support options as the PreForm software for Formlabs does. In order to print without supports on the Cube I made the sphere flat at the top, but there were issues with printing the neck of the bulb as there was so support for it to print over/connect to, making that area brittle.
IMG_1508IMG_1509

Tests to create design with Cube

I also learned that you can copy several of the same parts into a print to allow for it to print quicker using a Formlab printer, which sped up the process alot!
IMG_1517

Printing with FormLab Printer

IMG_1504

Printing with Cube

Connecting the NeoPixels to be insync with the Firmata code was hard and I am still figuring this part out better at the moment. I will post when I have this fixed!

LESSONS LEARNED:

1. I have low knowledge in Signal Processing, but it was a good start to my task of learning about wearable technology and has helped me focus on what I need to learn next semester

2. Creating the software took me time as it was hard to navigate between menus and I had trouble moving words while utilizing a timer. I spent too much time on making this work, that the end “AH HA” moment needed more attention.

3. I got to work with Max MSP and PureData which was a great opportunity, and although it was just beginning it was nice to work in both softwares and understand their basic setups better. I was previously overwhelmed by each.

4. Balancing between the physical components and software components was not easy as if one didnt work then you couldnt utilize the other.

RELATED WORK:

Athos – Athos is a wearable fitness shirt that utilizes a six-axis accelerometers, EMG to measure muscle effort, muscle target zones and muscle fatigue. Heart rate and breathing patterns are tracked to further enhance you overall performance, and this device determines your recovery rate to truly maximize your workout.

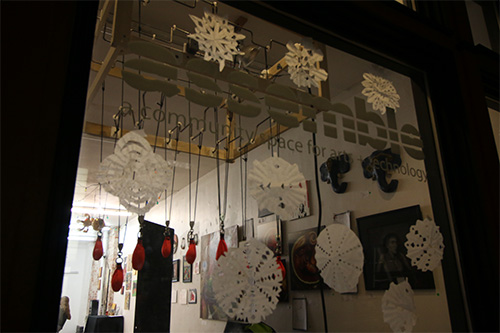
Mio Link- Heart Monitor with Bluetooth connectivity, acknowledges current training zone by color on the wristband. Images below is off of the Mio Website . It indicates the 5 heart rate zones that are tracked by the heart rate monitor.

Screen Shot 2014-10-26 at 6.14.54 PM

The Teletickle

Final Project — alanhp @ 9:04 pm

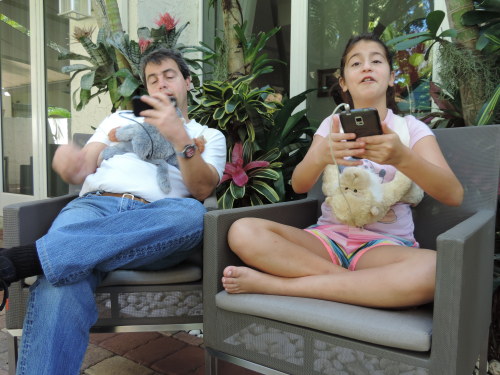
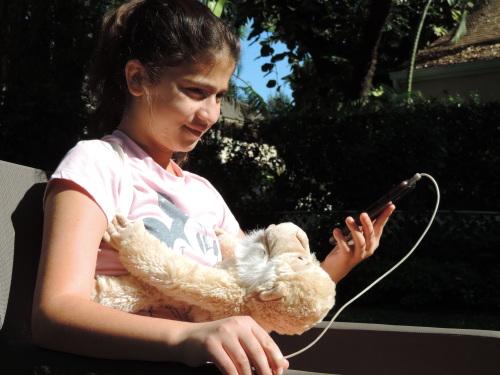
The Teletickle allows users to send and receive tickles using a custom web-app located at teletickle.com. Rather than sending and receiving texts, with the teletickle I wanted to enable users to send and receive a more sensorial and expressive message in the form of tickles. The system is meant to be experienced playfully, it is a device intended to make users laugh and enjoy the experience of being tickled and tickling. The monkeys in which the electronics are encolsed add to the playful and silly nature of the project which research has shown makes for a better tickling sensation. Further, the user who receives a tickle does not now when the motors that cause the tickling will be activated or which motors will be activated, the tickling is entirely controlled by the user that sends the tickle.

There is previous work done in this space, in particular this work took from the work of affective feedback done in the Human Computer-Interaction community en.wikipedia.org/wiki/Affective_haptics Specifically, the research findings that showed how the tickle is more effective when it is experienced randomly and when the design of the system is silly or humorous.

The project was built with a divide and conquer approach. Rather than trying to build the entire system, my approach was to build the pieces of the device and then connect them. There were two primary systems to build, the web application and the Arduino software to interpret audio signals. Each part of each of these systems was individually built, the design of the web app was separated from the server side of the web app, the communication between these parts was built using web sockets which was also independently developed. The interfacing between the Arduino and the web app was done through the audio signal outputted through the headphone jack of the phone, this was built and tested separately with a different Arduino program before being integrated. I think key to developing the project was building each part of the system separately, isolating parts to getting them to work before integrating them to the whole.

Some lessons learned: divide and conquer is a strategy that works well for me, scoping the project is essential to making sure you can finish it on time, haptic feedback needs to be hard pressed to the body to be felt, audio signals from the phone can be used to control anything using fast fourier transform.

Some references:

  • en.wikipedia.org/wiki/Affective_haptics#cite_note-1
  • Dzmitry Tsetserukou, Alena Neviarouskaya. iFeel_IM!: Augmenting Emotions during Online Communication. In: IEEE Computer Graphics and Applications, IEEE, Vol. 30, No. 5, September/October 2010, pp. 72-80 (Impact factor 1.9) [PDF]
  • Chris Harrison, Haakon Faste. Implications of Location and Touch for On-Body Projected Interfaces. Proc. Designing Interactive Systems, 2014, pp. 543-552.


teletickle4

teletickle3

teletickle2

teletickle1

KibbleControl

Kibble Control! This is a pet bowl device that can connect to the internet! Sure, there are other bowls out there. Bowls that detect RFID. Bowls that schedule your cats feeding time. Bowls that connect to the internet and can update you on when your cat ate. Problem is, none of these bowls have the ability to accommodate multiple pets while being able to connect to the internet and allow for the pet owner to control exactly how much the cat should eat each meal and at what time. No other bowl understands whether one pet tends to bully another away from the food bowl and will update the owner over a connected web application. Other bowls that do connect over the internet do so via a phone app, which requires a smart phone to be used, and cannot be accessed via other devices.

Point is, we thought of [almost] everything! It’s a work in progress but we believe we are on to something here. We plan to continue to explore our options regarding this project because it was a lot of fun to work on, it benefits me personally to make this bowl the best it can be so at least I can use it in my home, and there does not seem to be any draw-backs to giving it a go when we have the time for it.

Horay for KibbleControl!

KibbleControl from Yeliz Karadayi on Vimeo.


IMAG0088

opened back

IMAG0089

closed back- locked in with magnets

IMAG0093

the mess inside

img3

img4

img9

img10

img11

img14

Vicious Cycle – Final Documentation

Final Project — pvirasat @ 11:48 am

So what is it?

‘Vicious Cycle’ is a machine that ‘promotes’ health and active lifestyle through a portion-controlled diet. Today’s obsession with insane workout routines and different types of diets (whether it be no carbs, Paleo, raw food, or an-apple-a-day diet – you name it) inspired me to work on this project. The goal is to reflect on the common mindset that it is absolutely acceptable to eat as much junk as you want as long as you exercise.

how does it work?

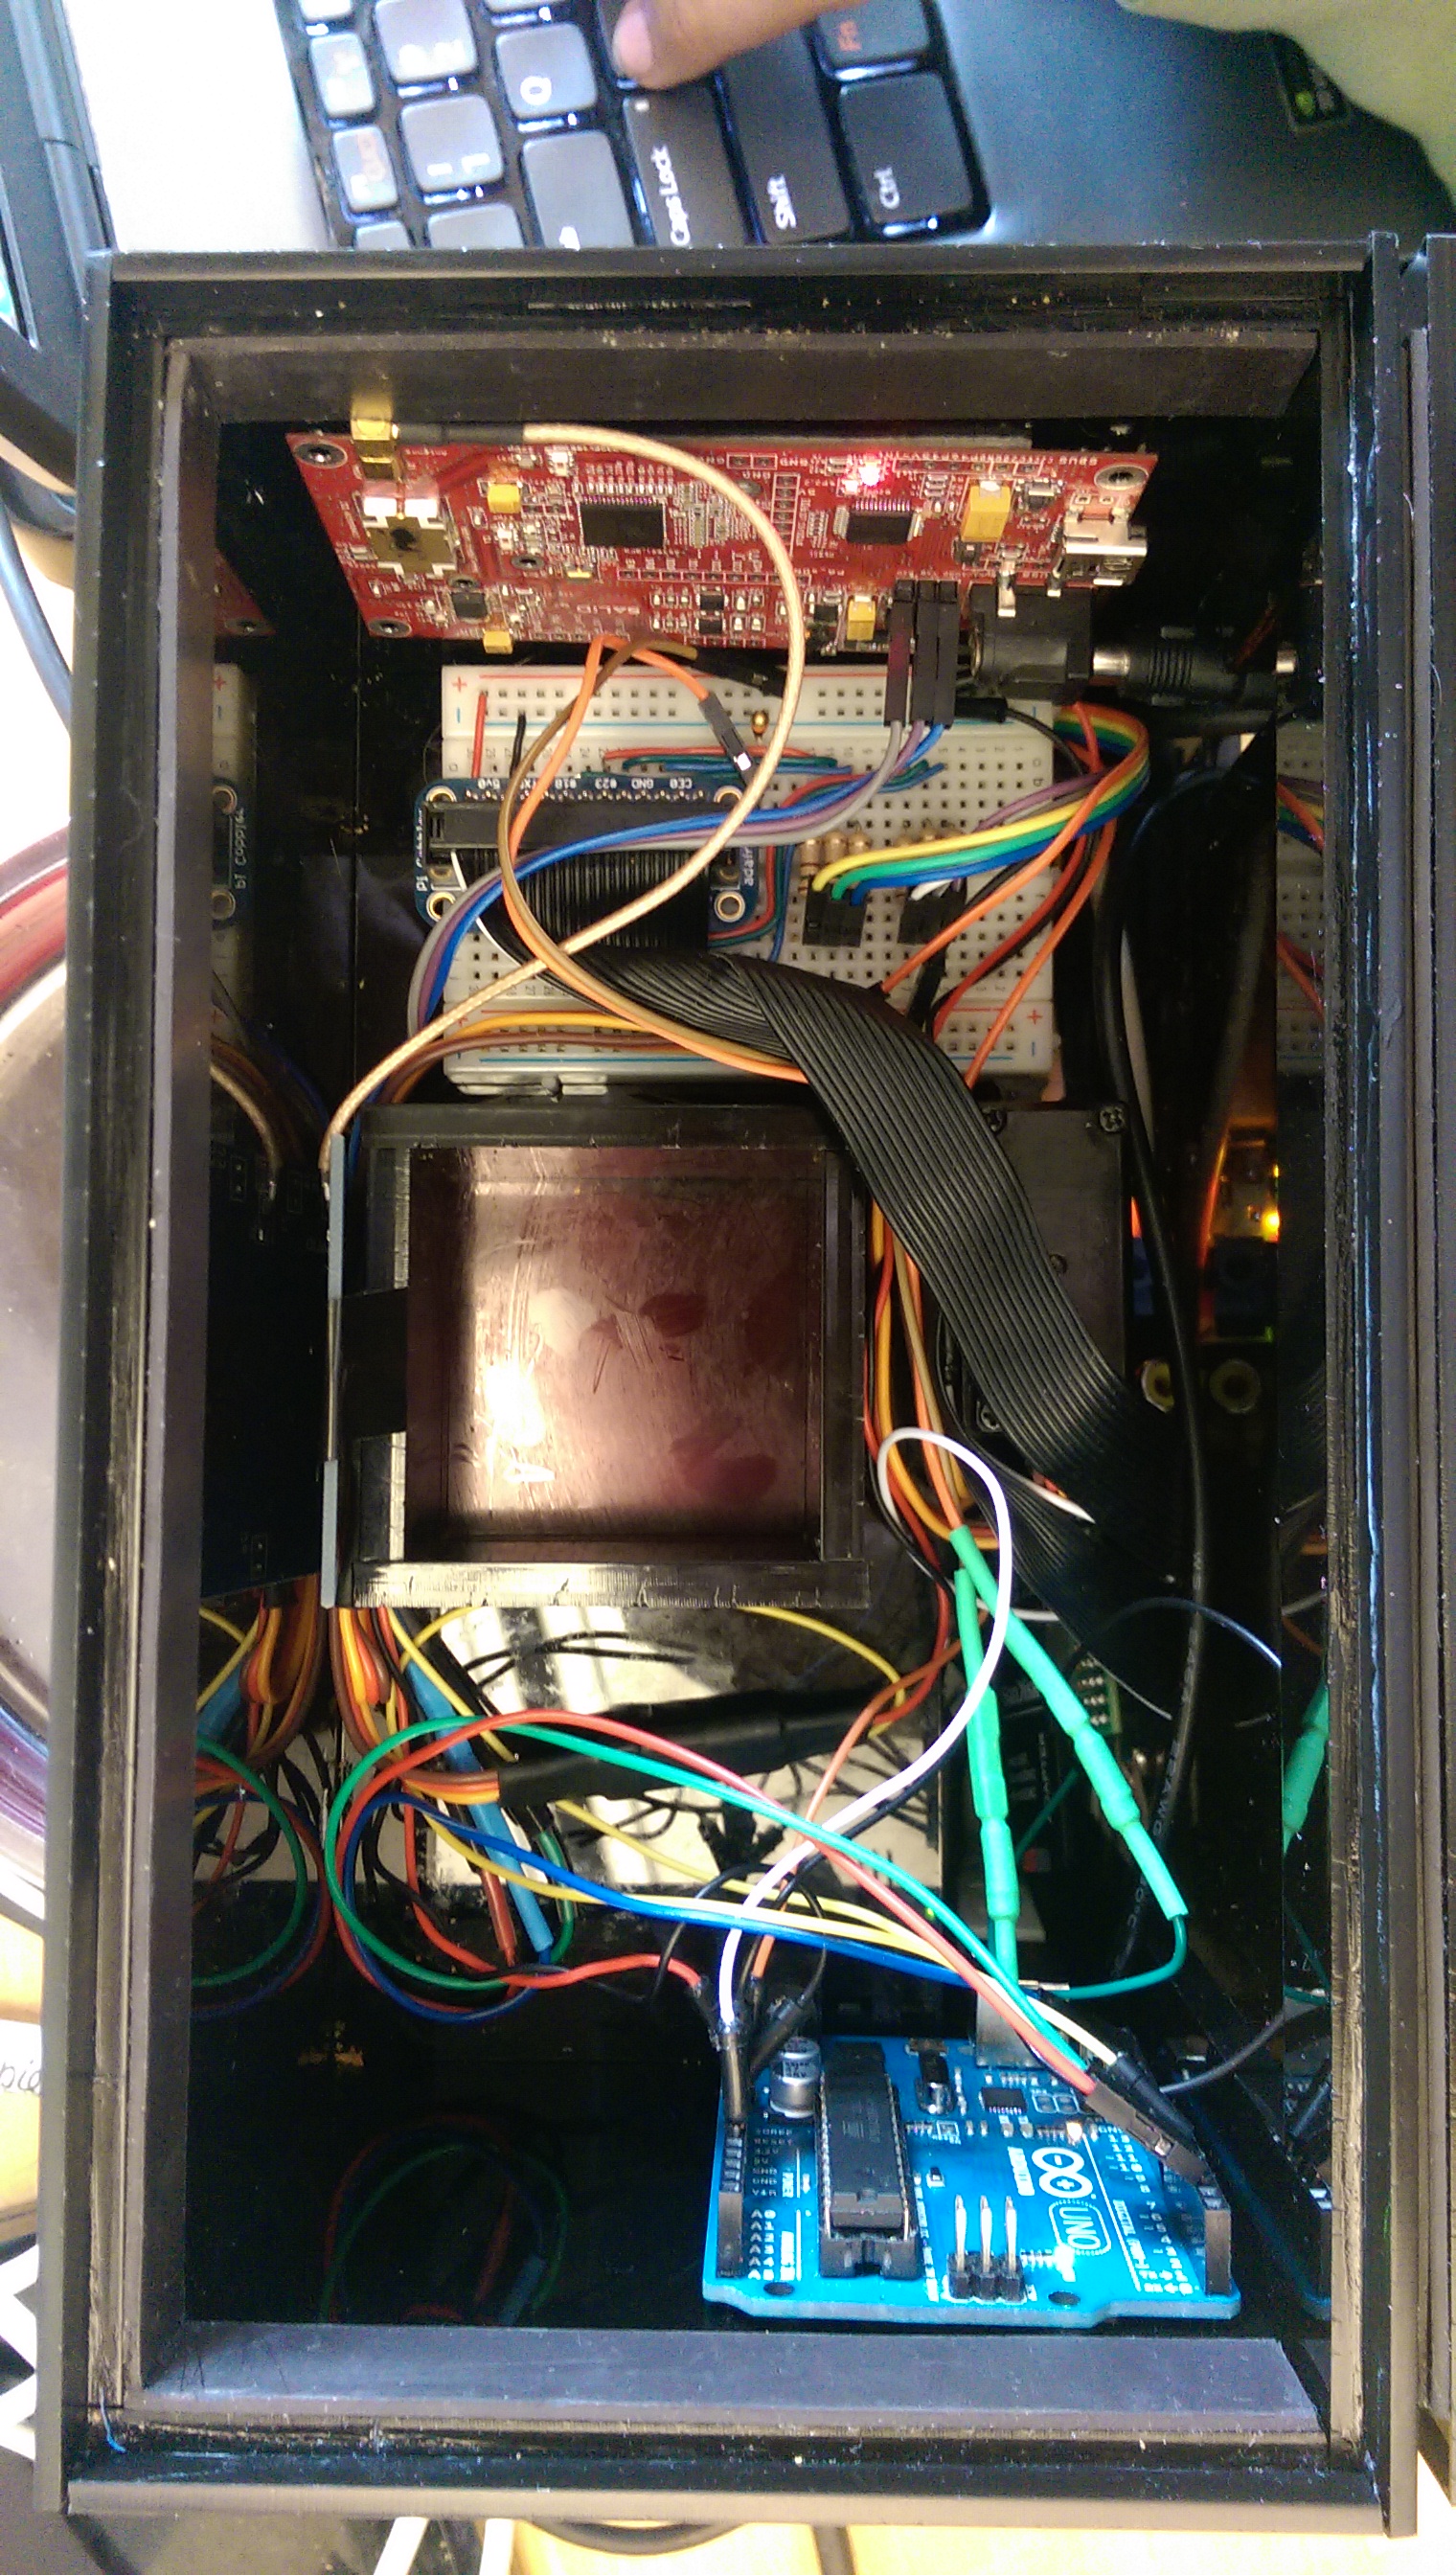
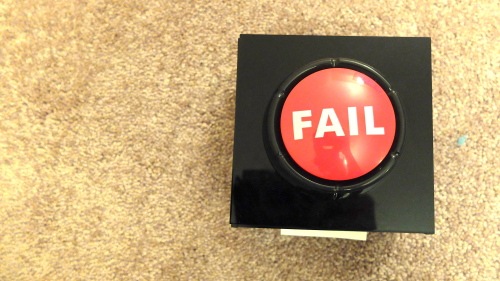
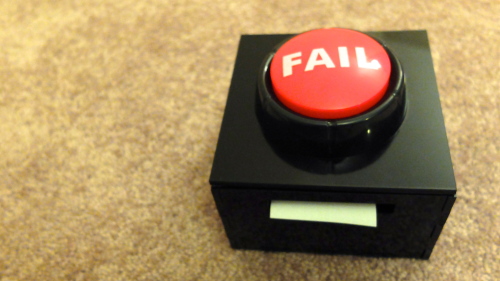
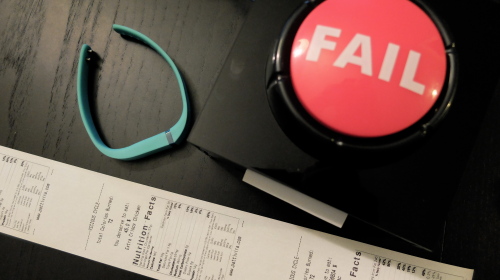
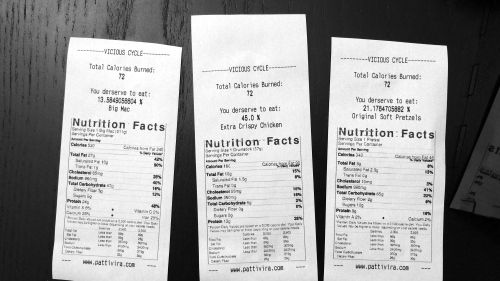
‘Vicious Cycle’ is a machine that spits out information about the food that you deserve to eat based on how much you exercise.

A Fitbit wristband records the number of steps and calories burned during your walk. The calories data is updated every time a button is pushed. The food is chosen randomly within the food database (all junk, of course), and information (calories burned, what food to eat, how much you deserve, the nutrition fact label) is then printed using a thermal printer connected to a Raspberry Pi.


The most difficult part about this specific project is coming up with a solid idea. A lot of the time, I tend to focus on the technology without spending enough time on the concept. Therefore, the work itself becomes more like a demo or a proof of concept, rather than a work of art that has meaning.

I originally wanted to work on a light installation based on my GPS data that I collected over the past year using OpenPaths, but I was not sure how to make the final deliverable meaningful using a limited number of lights. I decided to go on a different direction, but I still wanted to use a self-quantified data, and that’s when I got the idea for this project. Once I had the concept down, I started prototyping using a raspberry pi, a thermal printer, and the data collected using the application runKeeper. However, I decided to use a Fitbit Flex to collect the workout data for the final show so anyone can just wear the wristband instead of having to download the app.

Here are some very useful links I used to get the project started.

For connecting a thermal printer to a Raspberry Pi

For getting data from runKeeper App and Fitbit

For generating nutrition label

For obtaining food nutritional information

I am very happy with the end result, and really enjoyed the final show at Assemble. Thanks Eric and Jake for a great semester!

DSCF4229

DSCF4230

DSCF4220

DSCF4225


Mano Extended – exploration

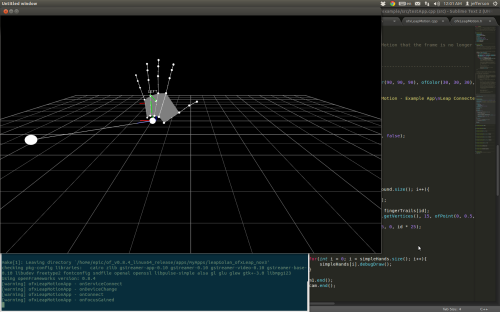
Parsing the stream of data from the Leap motion proved no easy task more me. Although I used Golan’s Leap Visualizer based on Theo’s ofxLeapMotion addon for openFrameworks. Once I got the data parsed and converted into OSC messages, it was time to get the OSC messages routed in pure data and mapped to the appropriate synthesis parameters. Here I present a few exploratory interactions.

I’m completely aware that these sounds aren’t pleasant. Since this is a long term project, I’m now in the phase of finding which gestures I like for controlling which style of synthesis, and this is a slow process. Although, these initial explorations provide good insight to the controller’s capabilities and it’s flaws.

Sometimes the Leap gets confused and decides that your right hand is actually your left, and it can only see from a specific angle, so any actions you make where you hands cross will probably confuse it, big time. This is called occlusion.

I fully intend to continue exploring this device for future work and I’m considering using it for my Master Thesis project, yet to be revealed ;).

This project was supported in part by funding from the Carnegie Mellon University Frank-Ratchye Fund for Art @ the Frontier.

I also include an annotated portfolio of research I’ve done for Aisling Kelliher’s Interaction Design Seminar on hand-gesture based systems for controlling sound synthesis.

IMG_1384.v01
IMAG1300

ofxLeapVisualizer

Sensate – Final Documentation

Assignment,Final Project — Tags: — tdoyle @ 5:48 pm

Sensate is a project that explores how we can communicate more intimately over the internet. The idea was sparked when I saw the Apple Watch introduction, specifically when they talked about sharing your heartbeat with someone you love. It struck me as such a different interaction with technology. It carried a human element across the digital network to another person. This got me wondering about other ways in which we might be able to achieve the same effect; using new technology to convey very human, emotional, and intimate feelings across the internet to people you care about.

(more…)

Update- project part2

Final Project,Technique — priyaganadas @ 4:17 am

I have been working on Max since last week. I have decided to use kinect to map depth and movement of a person. When the location of the person interacts with the 3d model of the dataset, sound will be generated.
This is the demo of test set up of Kinect-Max-Ableton working together. Patch creates sound based on hand motion and distance(depth) from the sensor.

Next Step is to import a 3d model of the database in the patch so that interaction of person and dataset can result in music.
Next Page »
This work is licensed under a Creative Commons Attribution-Noncommercial-Share Alike 3.0 Unported License.
(c) 2024 Making Things Interactive | powered by WordPress with Barecity