Activate Yourself

Activate Yourself from Amy Friedman on Vimeo.
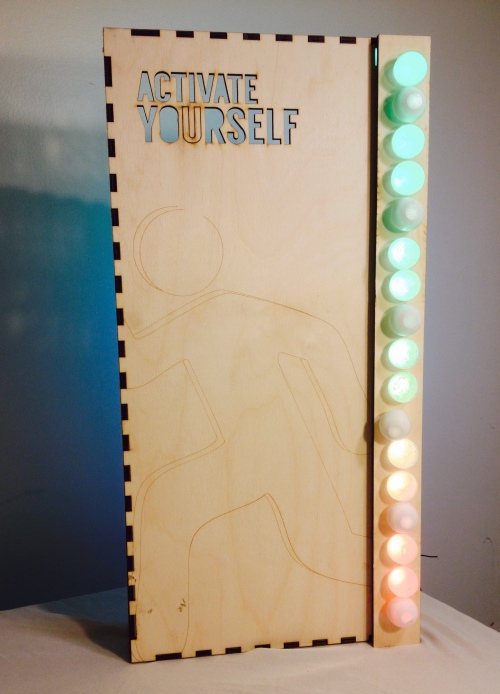
FullSizeRender

IMG_1584

IMG_1561

FullSizeRender (1)


CONCEPT/PROCESS:

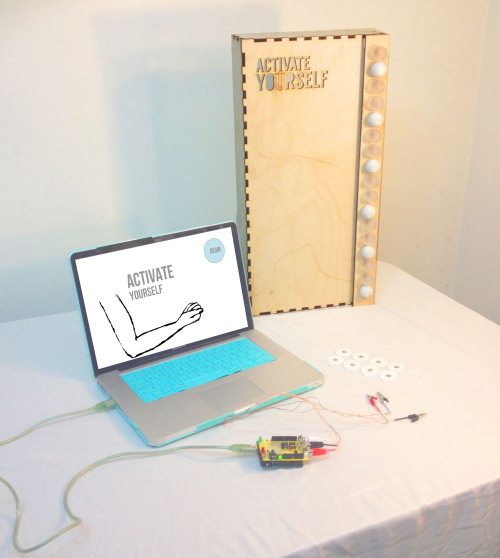
Activate Yourself is a visualization aid, to understand muscle activity. Users follow on screen prompts to visually understand if their muscle of choice is being used during different motions they utilize. This is a being step to better understand our bodies and whether we “activate” ourselves during different activities the way we think we are.

My main interests involve body monitoring, and how information is conveyed to users. Many times we visualize data in a way that not everyone can understand, therefore our experience with data doesn’t add value to our everyday lives to change how we act or inform us about healthy activity. The notion of Muscle Activity can help understanding stroke victims ability to move during rehabilitation, trainers/athletes/kids to understand when they are using the muscles they want, and overall maximize training by understanding if your body is responding the way you believe it to be. Using Processing 2.0 I created the onscreen prompts and software. The software connected to the EMG Shield/Arduino through Firmata imports into Processing, and using the Firmata Code on the Arduino.

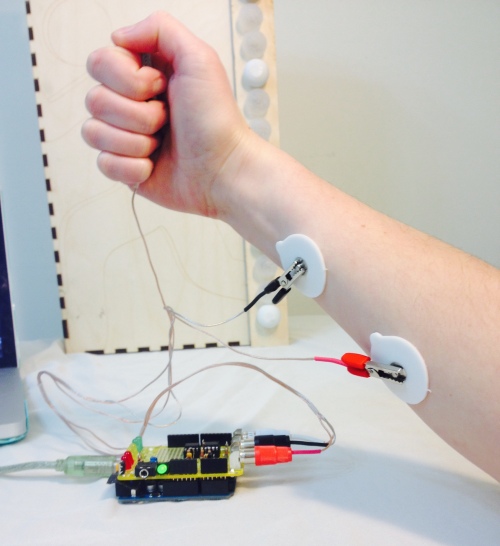
Using the Backyard Brains Electromyogram(EMG) Arduino Shield I was able to retrieve readable data that informed whether a muscle had been “activated” or used which someone was moving. The higher the analog read, the more the muscle was trying to be utilized through local electric muscle activity sent from the brain. I first began by testing out the different Backyard Brains experiments, such as Muscle Action Potentials (measuring the amount of activity), and Muscle Contraction and Fatigue. The latter is what inspired my original path to further understand our bodies.

We currently visualize signals through sin waves, but is there a better way to visualize this information. I then tried to utilize the EMG to detect muscle activity to determine if a muscle is fatigued, not active, active, and rested. This information could optimize working out and lifting. A wearable versatile device that could be worn on any muscle group with haptic or LED feedback would be the idealized version of this project.

I first began by reading how EMGs measure information, can muscle fatigue be recognized, how would I even do this? I read the following articles:

Sakurai, T. ; Toda, M. ; Sakurazawa, S. ; Akita, J. ; Kondo, K. ; Nakamura, Y. “Detection of Muscle Fatigue by the Surface Electromyogram and its Application.” 9th IEEE/ACIS International Conference on Computer and Information Science, 43-47 (2010).

Subasi, A., Kemal Kiymik, M. “Muscle Fatigue Detection in EMG Using Time-Frequency Methods, ICA and Neural Networks”  J Med Syst 34:777-85 (2010).

Reaz, M.B.I., Hussain, M.S., Mohd-Yasin, F. “Techniques of EMG signal analysis: detection, processing, classification and applications.” Biological Procedures Online 8: 11-35 (2006).

Saponas, T.S., Tan, D.S., Morris, D., Turner, J., Landay, J.A. “Making Muscle-Computer Interfaces More Practical.” CHI 2010, Atlanta, Georgia, USA.

I created my own analysis of my data using the procedures in the article:

Allison, G.T., Fujiwara, T. “The relationship between EMG median frequency and low frequency band amplitude changes at different levels of muscle capacity.” Clinical Biomechanics 17 (6):464-469 (July 2002).

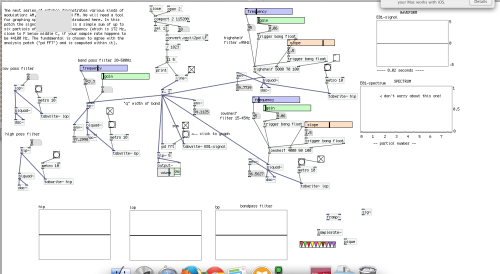
I realized that in order to better understand the data I needed to filter it to get rid of external noise, and compare frequencies using Signal Processing, after filtering the data I could use Machine Learning or Neural Network tools to recognize patterns of fatigued, active, rested or not-active. With the help of Ali Momeni, CmuArtFab Machine Learning Patch and my resources above, I created a patch in Max MSP by filtering the signal from Arduino, but this wasn’t enough to be able to recognize the signal. The sample rate of my data is only 1024 while the samplerate for Audio is 44100Hz making my data very tiny when transformed using the Fast Fourier Transform(FFT) settings in Max MSP. It was recommended that I try to utilize Pd. I was able to filter the data, but as I am not rehearsed in Signal Processing methods it was unclear to me how to go about the next phases to utilize Neural Networks.

Screen Shot 2014-12-16 at 7.43.30 PM

Max Patch


Screen Shot 2014-11-17 at 6.32.19 AM

PureData Patch

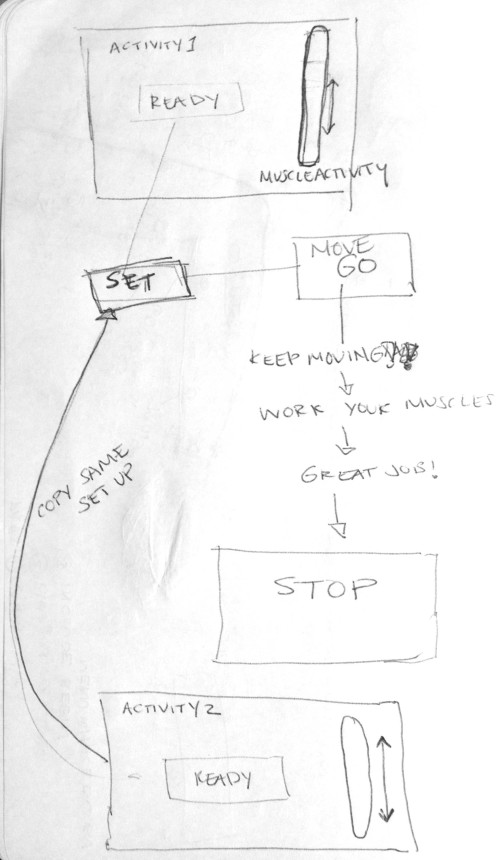
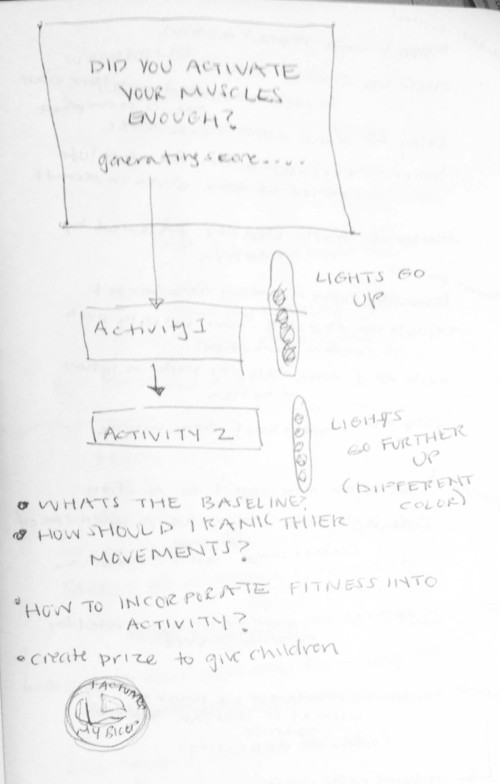
At this point I refocused my project scope to help visualize muscle activity, or as the Backyard Brains experiment calls this “Muscle Action Potentials”. Using Processing 2.0, I created the “Activate Yourself” software which instructed users how to put on an EMG based muscle choice (the tricep, bicep or forearm), gave them on screen instructions and feedback for each timed activity, while showing their activity levels on a metered display. Creating the software took me time as it was hard to navigate between menus and I had trouble moving words while utilizing a timer. I spent too much time on making this work, that the end “AH HA” moment needed more attention. I spent time sketching out the interactions and how they should experience the timers.
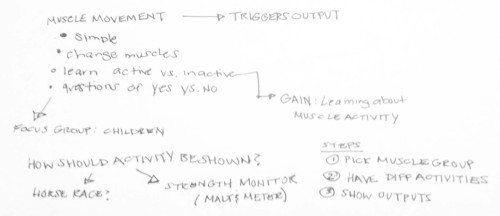
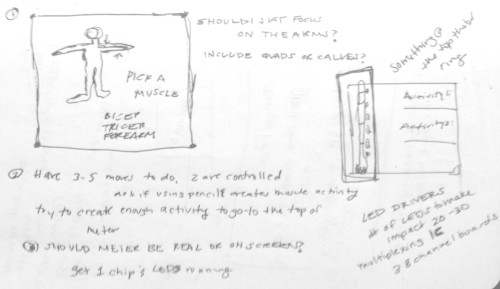
IMG_1546

IMG_1547

IMG_1551 IMG_1552

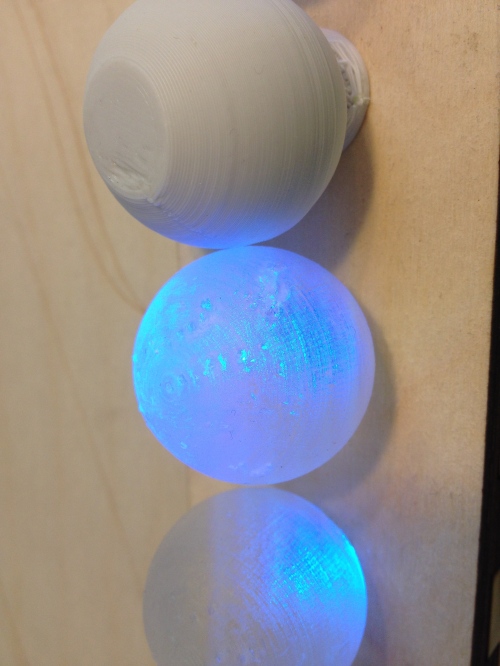
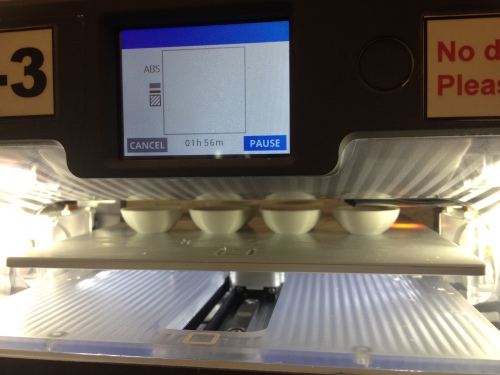
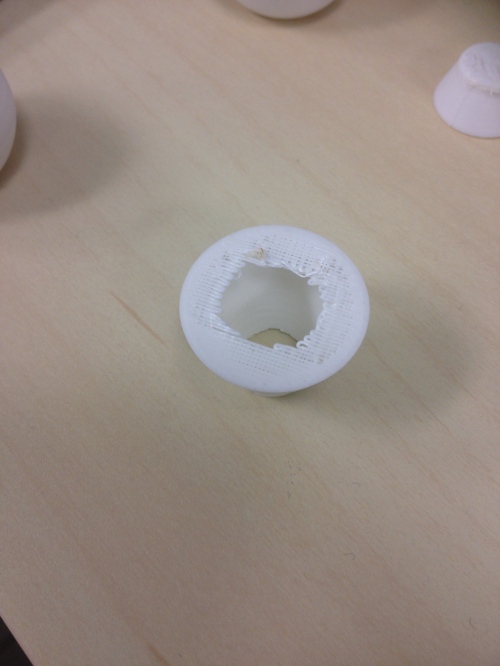
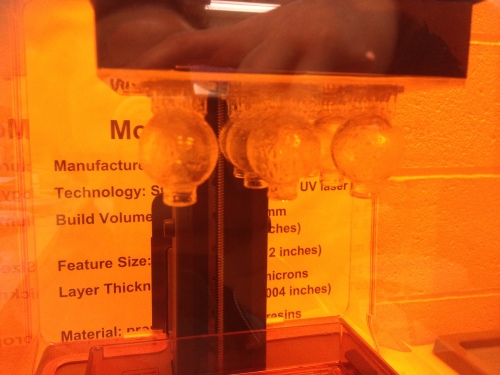
For the Physical Visual Piece, I used Rhino to create a Shadow Box and 3d printed Lightbulbs using the Cube and FormLab printers. The FormLab printer was able to print the bulbs without any issues, while the Cube required supports and the Cubify software doesnt provide this type of additive support options as the PreForm software for Formlabs does. In order to print without supports on the Cube I made the sphere flat at the top, but there were issues with printing the neck of the bulb as there was so support for it to print over/connect to, making that area brittle.
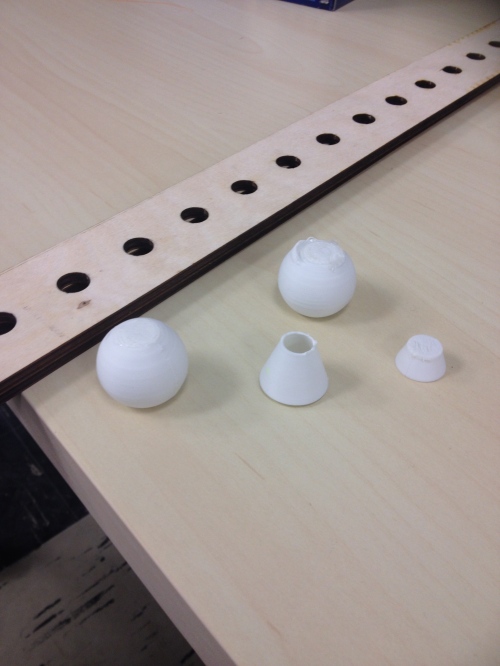
IMG_1508IMG_1509

Tests to create design with Cube

I also learned that you can copy several of the same parts into a print to allow for it to print quicker using a Formlab printer, which sped up the process alot!
IMG_1517

Printing with FormLab Printer

IMG_1504

Printing with Cube

Connecting the NeoPixels to be insync with the Firmata code was hard and I am still figuring this part out better at the moment. I will post when I have this fixed!

LESSONS LEARNED:

1. I have low knowledge in Signal Processing, but it was a good start to my task of learning about wearable technology and has helped me focus on what I need to learn next semester

2. Creating the software took me time as it was hard to navigate between menus and I had trouble moving words while utilizing a timer. I spent too much time on making this work, that the end “AH HA” moment needed more attention.

3. I got to work with Max MSP and PureData which was a great opportunity, and although it was just beginning it was nice to work in both softwares and understand their basic setups better. I was previously overwhelmed by each.

4. Balancing between the physical components and software components was not easy as if one didnt work then you couldnt utilize the other.

RELATED WORK:

Athos – Athos is a wearable fitness shirt that utilizes a six-axis accelerometers, EMG to measure muscle effort, muscle target zones and muscle fatigue. Heart rate and breathing patterns are tracked to further enhance you overall performance, and this device determines your recovery rate to truly maximize your workout.

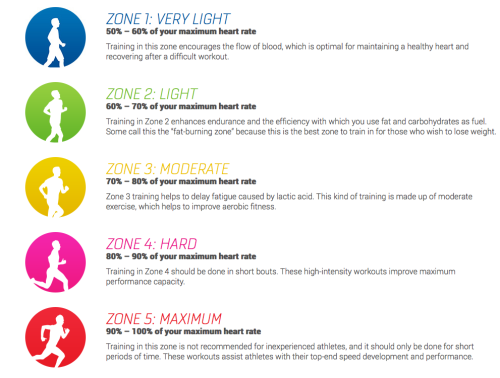
Mio Link- Heart Monitor with Bluetooth connectivity, acknowledges current training zone by color on the wristband. Images below is off of the Mio Website . It indicates the 5 heart rate zones that are tracked by the heart rate monitor.

Screen Shot 2014-10-26 at 6.14.54 PM

“Simplified” Concept Video

Uncategorized — amyfried @ 8:15 am

Simplified Concept Video from Amy Friedman on Vimeo.

Directions and Current Market

Final Project — amyfried @ 6:47 pm

In biology class we learn about the heart, how it pumps blood throughout the body, and how oxygen is inhaled through the lungs. When you lift you inhale and exhale to maximize movements, but why do you do this? How does one know they are training their body in a healthy way or when their muscles are fatigued (rather than based on feeling)?

Heart Monitor – To know what ones heart rate is we measure the pulse. Using an LED the change in color on the finger tells when blood is moving.

Electromyography (EMG) is used to determine muscle fatigue

“Fatigue is a phenomena that accompanies repeated muscular exertion. The ability of the muscle to produce force is reduced as fatigue occurs. Local muscle fatigue is manifested in electromyography (EMG) signals by a shift in the EMG power spectrum from high to low frequencies.” (www.sbir.gov/sbirsearch/detail/259138)

How can this information be simplified to a user and be understood in a different way outside of the realm of medicine? Should visualizations of the body be included?

Current Market

Mio Link

Heart Monitor with Bluetooth connectivity, acknowledges current training zone by color on the wristband. Images below is off of the Mio Website . It indicates the 5 heart rate zones that are tracked by the heart rate monitor.
Screen Shot 2014-10-26 at 6.14.54 PM

www.mioglobal.com/Default.aspx

My Issues: The wristband shows a simple out put of color, but you have to remember what that means and how it is important to incorporate that into your workout, a feed back of why and how long would be helpful to explain what the training is doing. You know you body is at its max due to red, but how fatigued are your muscles compared to heart rate?


Components:

I am currently using the products below to extract data and understand it to the simplest of variables so create a component that outputs the information in a simplified, non-medical manner.

EMG Spikershield from Backyard Brains

backyardbrains.com/products/emgSpikershield

PulseSensor by PulseSensor

pulsesensor.myshopify.com/


Color Detector

Submission — amyfried @ 7:47 am

Color Detector from Amy Friedman on Vimeo.

photo 3 photo 2

Concept: Our concept was to create an encoded message device, which will output a secret message if the right colors are recorded by the camera in the correct sequence.

Process: First we needed to create the program that would be able to read blob detections to identify one color. Our goal was to have 3 colors, red, black  and blue. Once we detected one color we utilized Python to detect two other colors. After this we developed the program to recognize color but record the sequence. If the detect sequence matched the “secret code” of blue black red then we allowed for the message to be given. Next we needed to create the mp3 file of what we desired the message to say and added it to the raspberry pi.

Lessons Learned: We learned how to use python, how to import into python, the language context needed to successfully utilize the python. We also learned how to time capture images using a camera and output audio files on the Raspberry Pi. We also learned how to detect color using captured images. We learned how to develop form for already preexisting objects, to be utilized in a new capacity.

We utilized these two websites to help with part of the coding:

learn.adafruit.com/playing-sounds-and-using-buttons-with-raspberry-pi/install-audio

www.cl.cam.ac.uk/~db434/raspi/blob_detection/

Assistive Motor Control Device

Precedent Analysis — amyfried @ 7:37 am

Academia: “Designing Interfaces for Children with motor impairment” by Marcela Bonilla, Sebastián Marichal, Gustavo Armagno, Tomás Laurenz (2010)

ieeexplore.ieee.org/stamp/stamp.jsp?tp=&arnumber=5750521

I found this article to be helpful as I want to utilize computers as solutions into my final project. I am unsure of how this will occur, whether it be a developed part of the research how to utilize user interfaces or part of the final product. The research team designed software specifically for those who possess motor issues. In this study they dealt with children in Uruguay who have Cerebral palsey. In the academic article it states that “According to the teachers, the screen layout of this activity is too compact and the controls are not enough different one from the other.” (p.249). Feedback such as this will be important for a devices success to manipulate the prototype.

Industry: “Magic Arms” by Tariq Rahman, & Nemours/Alfred I. duPont Hospital for Children (2012)

Emma has Arthrogryposis Multiplex Congenita a disorder in which the joints are grown abnormally.The technology used to create the customized device was a Stratasys 3D printer. The Wilmington Robotic Exoskeleton was already created by the Nemours Biomedical Research, but not to an adequate size for a child. The researchers created casts and molds of the child to understand what her dimensions were and how devices could be adapted for a small child. I would like to utilize the idea of customization 3d printing to be able to create a device to help those with mobility issues. User centered research is another important aspect of the video which I would like to utilize, without patient feedback I wont be able to create a product with a purpose.

Art: “Third Arm” by Stelarc (1980)

Ars Electronica 1992 – Stelarc “The Third Hand” from ars history on Vimeo.

Stelarc Third Hand

Stelarc created this performance piece as an extension of his body and performed with it from 1980 until 1998 traveling to Japan, the USA, Australia and Europe. According to the website of Stelarc (found above) “The Third Hand has come to stand for a body of work that explored intimate interface of technology and prosthetic augmentation- not as a replacement but rather as an addition to the body.” I found this piece to be intriguing as it utilizes mechanics to create a third arm. With those who are vision or motor impaired an extension of the body can allow for them to manipulate objects in a way they were unable to do previously. I think utilizing the ideas of addition as stated on Stelarcs website will allow for an integrative experience as you arent trying to fix what is already existing rather add to what you have.


I will be working towards developing a product that will again users with motor control issues. The most important aspect of this project is to find a participant to help me throughout the process. I dont want to just create a project with user-research. My goal is to have a working prototype to be shown off in December which outlines the journey of adapting the device to the users needs. I have already received the Frank-Ratchye Fund for Art @ the Frontier grant from the Studio for Creative Inquiry to hack a 3D printer to understand the benefits of rapid prototyping and how we can create customizable parts.

Ping Pong Raspberry Pi

Uncategorized — amyfried @ 3:11 pm

photo

1 2

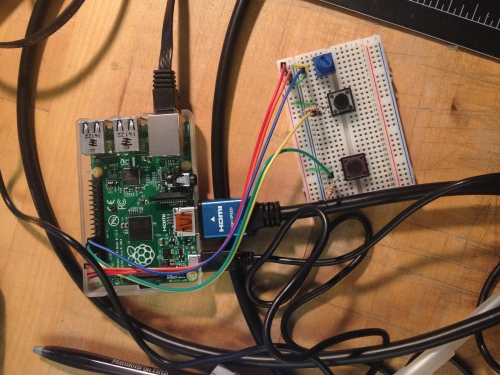
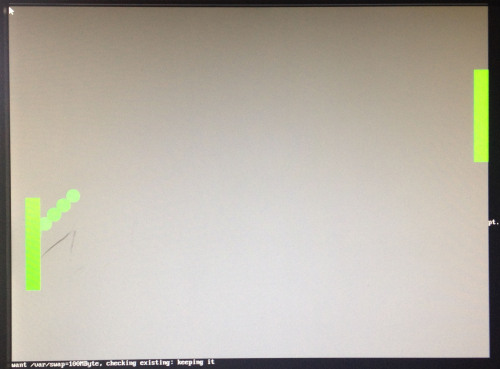
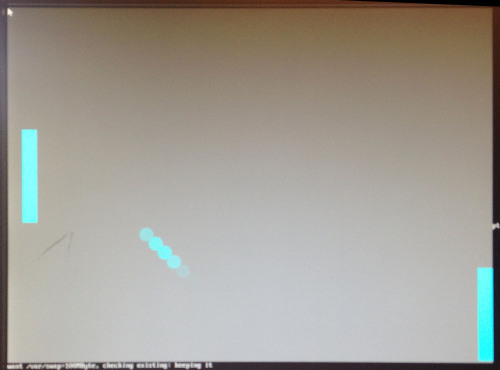
Concept: The main concept was to create a ping pong game using openFrameworks, raspberry pi, and 3 inputs from sensors or buttons.

Process: I began with using one button to change the color of an ellipse from red to green when pushed. Next I added in a rectangle to move up and down when the button is pressed, I also changed the code of the ellipse to add speed to its x and y directions. When the ellipse hits the edges of the preset window it bounces off at an angle. When I got that to run I added a second button and another rectangle to be moved up and down by the push of the button. Finally I attached a potentiometer to increase the ellipses speed when the potentiometer is moved (digitalWrite set on HIGH).

Lessons Learned: This was my first time working with a raspberry pi, and openFrameworks. I have been familiar with Arduino, and Processing 2.0, but it was a new experience to work in openFrameworks which allows to work in unison the elements of the other programs. In order for me to understand openFrameworks I went step by step to add elements to the program to expand upon. In processing I would be able to make a rectangle in Center Mode, but errors kept occurring so I couldnt utilize this in openFrameworks. Next I tried to create collisions by determining the distance between the center of the ellipse and the length of the pong paddles. In Processing 2.0 I would just use dist() to determine this number, but in openFrameworks I had trouble using this command to work for me. I also found out that to create collisions one should use the gravity tool, but I couldnt figure out how to use this function also.

Project01: “isnOre” By Amy Friedman (2014)

Uncategorized — amyfried @ 6:36 am

isnOre from Amy Friedman on Vimeo.


IMG_1179 IMG_1175

photo 5

Concept:

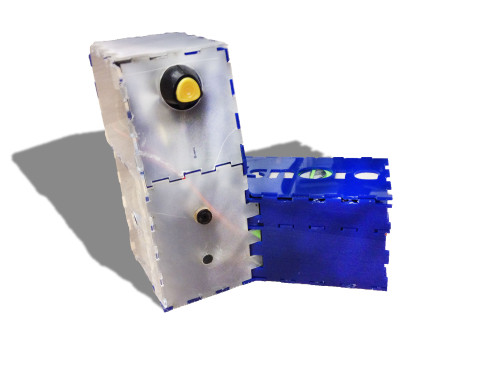
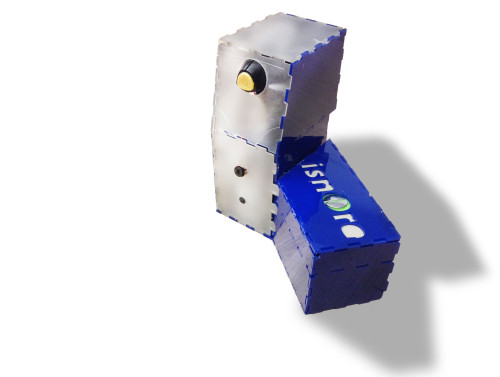
I hate when someone is sleeping in the same room as me and snores. It gives me a headache, I cant sleep at all and I am always cranky the next day no matter what. isnOre is a device to detect snoring and inflicts disturbance to those who snore so they understand the impact it has upon others. Once isnOre detects snoring an alarm is set off and based on the origin of the noise, isnOre spins to face the device and sets off a water gun to spray the snorer and annoy them.

Process:

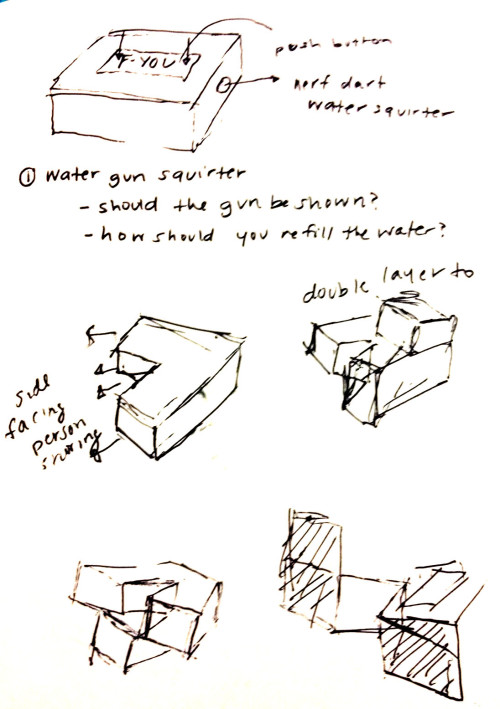
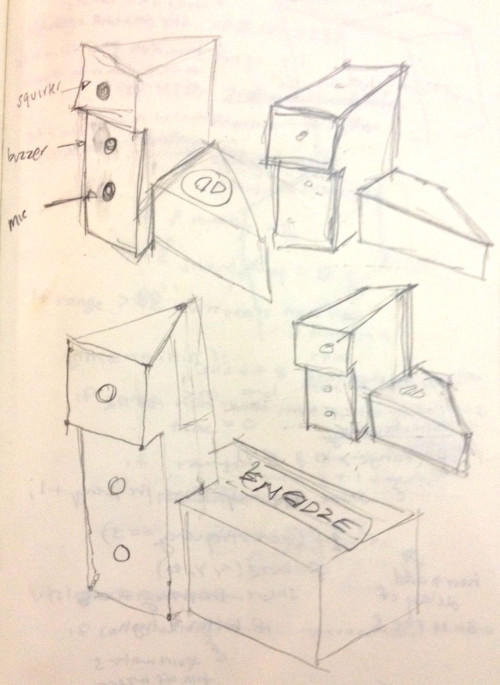
I began with figuring out my initial concept by looking at precedence and creating a blog of  “Precedent Analysis” of what the capabilities of a microphone input can be.  Then I chose to focus on snoring as it has always been an issue I have had when trying to sleep. From that point I began to look for what elements I needed to create the product and what the outputs should be to inflict pain/annoy snorers. I looked at dart guns, stun guns, shocks, water guns, and they came down to an alarm system that outputs a buzz. I then figured out the sequence of events and began to sketch out forms to maximize the effect and input of each sensor based on placement.

photo 1 photo 4

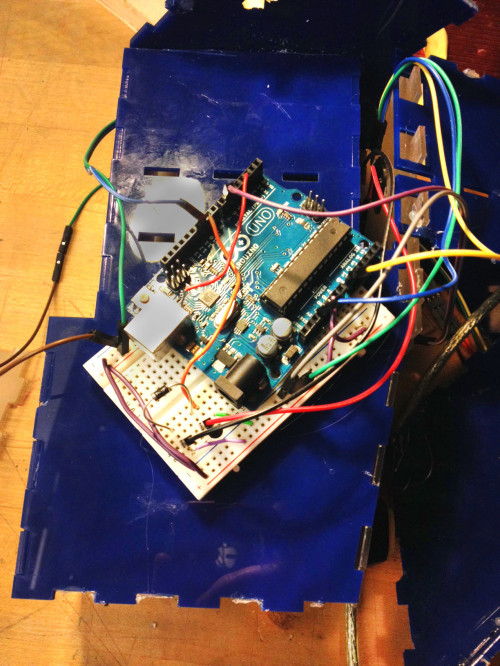
I created a cardboard prototype to understand the design better and used plans and sections to determine the dimensions of each element in the space. Next I created a 3D model of the design and used it to make a laser cutter file so I could utilize the laser cutter to cut acrylic.

Lessons learned:

I learned that a one week turn around time is hard to accomplish, but manageable as long as you dont attempt something that is too far out of reach to achieve. I learned that no matter how well designed the 3D model, and laser cutter file there will always need to be adjustments. I need to make sure to understand the cut of the laser better when putting pieces together. Using a microphone was a new experience for me and there are lots of manipulations that can be done using arduino and other programs that I want to explore and find out.

Precedent Analysis_Project01_Amy Friedman

Assignment,Precedent Analysis,Reference — amyfried @ 10:49 pm

Scanadu Scout™ – The first medical Tricorder


“The Power of Microphones as Medical Sensors”
. Posted in Electronic Components by Brian Buntz on June 3, 2013
Credit of project to: John Stankovic, Shahriar Nirjon

This compact sized device is meant to measure vital signs to allow people to understand what their body is doing, comparable to what is measured while one is in the emergency room. It is less invasive than the traditional product. This product uses 32-bit RTOS Micrium platform, Bluetooth 4.0, micro USB Adaptor, Electrodes for an EKG that convert to FM sound signals and are sent to the built-in smartphone microphone. I find it interesting that amount of data that can be achieved in a short span of time, and I am interested in healthcare technology which this qualifies as. I can borrow the idea of compacting several elements to an object. The issues I have is that the data is only read for a short time not consistently and therefore not much can be determined from the data incorporated in the element.

The Dash — Wireless Smart In Ear Headphones

Created to: Bragi in Munich, Germany

These earbuds are meant to track your everyday performance which working out. This product uses an earbone microphone, bluetooth 4.0, 4 GB storage, 32-bit arm processor, digital signal processor, analog frontend with 22 bit ADC, passive noise isolation, audio transparency, and other sensors. The earbone microphone records your personal vocals which reducing the noise surrounding you. When you run you understand your vitals, and are able to block out noisy elements. The products allows one to workout without invasive wires or noise, and monitors your fitness. Im attracted to this project due to the healthcare wearables, and would borrow the idea of a sleek compact design and important of bluetooth. I find that the product would need to be more interactive to understand its true potential as it relies on the smart phone to convey information.

Metro Dot-Braille Bracelet for Independent Train Travel

metro_dot

Designers: Hoyeoul Lee, Jinwoo Kim and Sangyong Choi
IDEA Award Entry 2012
Article from yankodesign.com
This object is a design idea, that hasnt been created. It utilizes a users voice and Electro Active Polymer, to give the braille of which station to get off at after the destination is given. There is silicone rubber, constant magnets, and Electromagnetic coil. I find this innovative as it is truly interactive and uses a microphone to convert information to be used by special needs. I find this use to be practical, but Im not sure how it entirely works.

Project 00 – Background- Amy Friedman

Background — Tags: — amyfried @ 12:08 am

I’m Amy Friedman, my background is in Architecture, but for my final year of school I focused on learning to code, design and develop wearable technology.

I want to create innovative, ergonomic wearable interactive technology to help decrease obesity rates by improving peoples’ daily activity, and further strengthening the importance of healthy living. There is a disconnect between what is advocated as a healthy lifestyle and what people truly accomplish each day.

My works can be found at www.amyefriedman.com . My works relating to this course involved Whisker, and Ba.S.I.S.

Ba.S.I.S from Amy Friedman on Vimeo.

This work is licensed under a Creative Commons Attribution-Noncommercial-Share Alike 3.0 Unported License.
(c) 2024 Making Things Interactive | powered by WordPress with Barecity