Activate Yourself
Activate Yourself from Amy Friedman on Vimeo.
CONCEPT/PROCESS:
Activate Yourself is a visualization aid, to understand muscle activity. Users follow on screen prompts to visually understand if their muscle of choice is being used during different motions they utilize. This is a being step to better understand our bodies and whether we “activate” ourselves during different activities the way we think we are.
My main interests involve body monitoring, and how information is conveyed to users. Many times we visualize data in a way that not everyone can understand, therefore our experience with data doesn’t add value to our everyday lives to change how we act or inform us about healthy activity. The notion of Muscle Activity can help understanding stroke victims ability to move during rehabilitation, trainers/athletes/kids to understand when they are using the muscles they want, and overall maximize training by understanding if your body is responding the way you believe it to be. Using Processing 2.0 I created the onscreen prompts and software. The software connected to the EMG Shield/Arduino through Firmata imports into Processing, and using the Firmata Code on the Arduino.
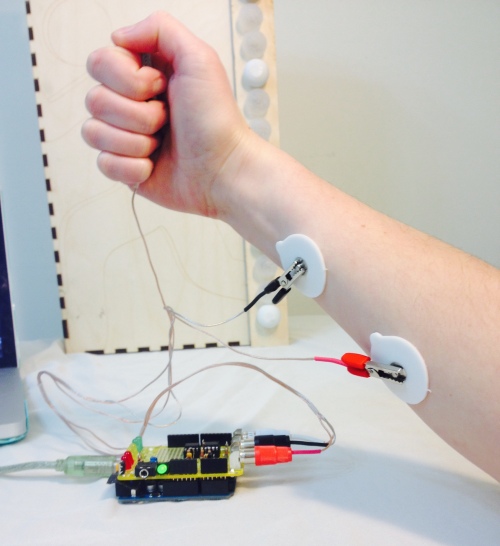
Using the Backyard Brains Electromyogram(EMG) Arduino Shield I was able to retrieve readable data that informed whether a muscle had been “activated” or used which someone was moving. The higher the analog read, the more the muscle was trying to be utilized through local electric muscle activity sent from the brain. I first began by testing out the different Backyard Brains experiments, such as Muscle Action Potentials (measuring the amount of activity), and Muscle Contraction and Fatigue. The latter is what inspired my original path to further understand our bodies.
We currently visualize signals through sin waves, but is there a better way to visualize this information. I then tried to utilize the EMG to detect muscle activity to determine if a muscle is fatigued, not active, active, and rested. This information could optimize working out and lifting. A wearable versatile device that could be worn on any muscle group with haptic or LED feedback would be the idealized version of this project.
I first began by reading how EMGs measure information, can muscle fatigue be recognized, how would I even do this? I read the following articles:
Sakurai, T. ; Toda, M. ; Sakurazawa, S. ; Akita, J. ; Kondo, K. ; Nakamura, Y. “Detection of Muscle Fatigue by the Surface Electromyogram and its Application.” 9th IEEE/ACIS International Conference on Computer and Information Science, 43-47 (2010).
Subasi, A., Kemal Kiymik, M. “Muscle Fatigue Detection in EMG Using Time-Frequency Methods, ICA and Neural Networks” J Med Syst 34:777-85 (2010).
Reaz, M.B.I., Hussain, M.S., Mohd-Yasin, F. “Techniques of EMG signal analysis: detection, processing, classification and applications.” Biological Procedures Online 8: 11-35 (2006).
Saponas, T.S., Tan, D.S., Morris, D., Turner, J., Landay, J.A. “Making Muscle-Computer Interfaces More Practical.” CHI 2010, Atlanta, Georgia, USA.
I created my own analysis of my data using the procedures in the article:
Allison, G.T., Fujiwara, T. “The relationship between EMG median frequency and low frequency band amplitude changes at different levels of muscle capacity.” Clinical Biomechanics 17 (6):464-469 (July 2002).
I realized that in order to better understand the data I needed to filter it to get rid of external noise, and compare frequencies using Signal Processing, after filtering the data I could use Machine Learning or Neural Network tools to recognize patterns of fatigued, active, rested or not-active. With the help of Ali Momeni, CmuArtFab Machine Learning Patch and my resources above, I created a patch in Max MSP by filtering the signal from Arduino, but this wasn’t enough to be able to recognize the signal. The sample rate of my data is only 1024 while the samplerate for Audio is 44100Hz making my data very tiny when transformed using the Fast Fourier Transform(FFT) settings in Max MSP. It was recommended that I try to utilize Pd. I was able to filter the data, but as I am not rehearsed in Signal Processing methods it was unclear to me how to go about the next phases to utilize Neural Networks.

Max Patch
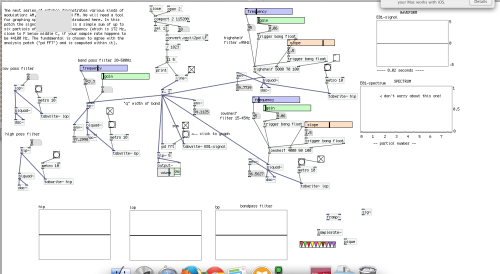
PureData Patch
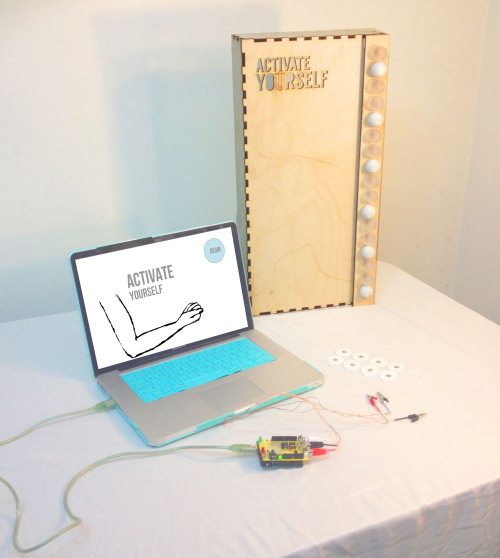
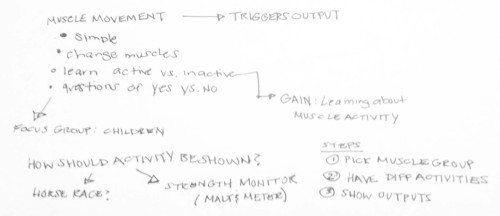
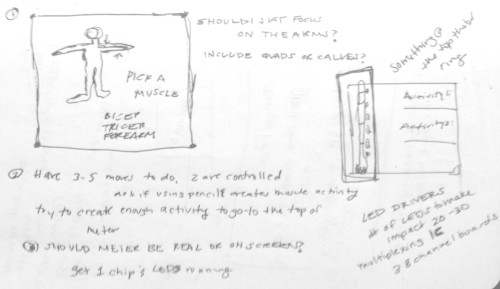
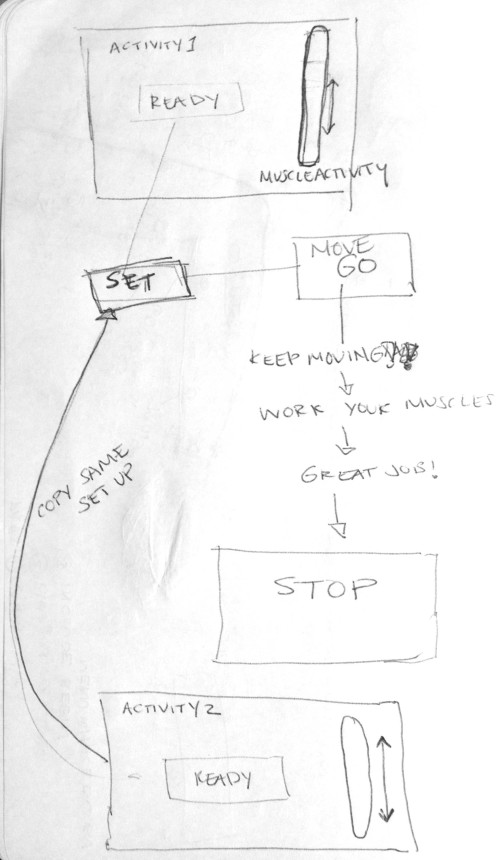
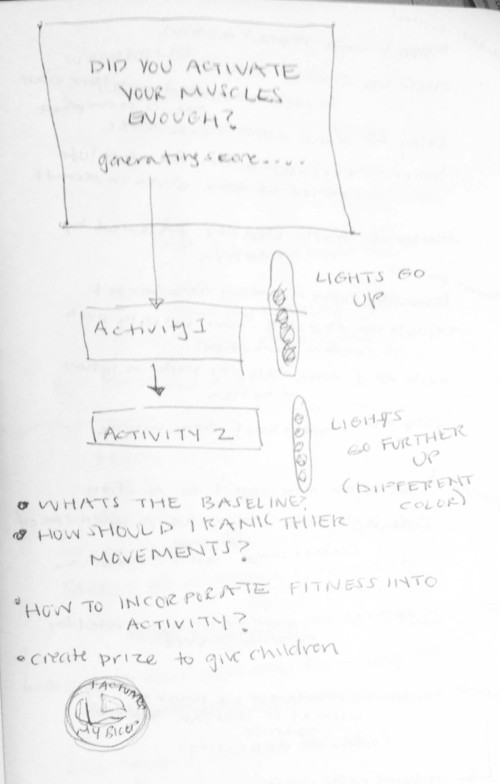
At this point I refocused my project scope to help visualize muscle activity, or as the Backyard Brains experiment calls this “Muscle Action Potentials”. Using Processing 2.0, I created the “Activate Yourself” software which instructed users how to put on an EMG based muscle choice (the tricep, bicep or forearm), gave them on screen instructions and feedback for each timed activity, while showing their activity levels on a metered display. Creating the software took me time as it was hard to navigate between menus and I had trouble moving words while utilizing a timer. I spent too much time on making this work, that the end “AH HA” moment needed more attention. I spent time sketching out the interactions and how they should experience the timers.
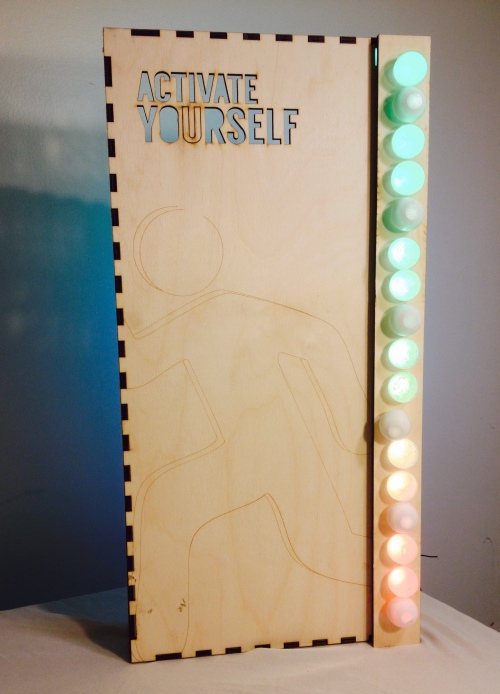
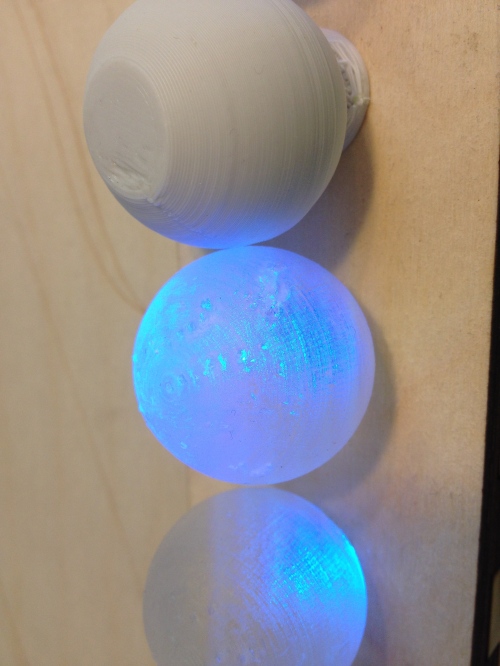
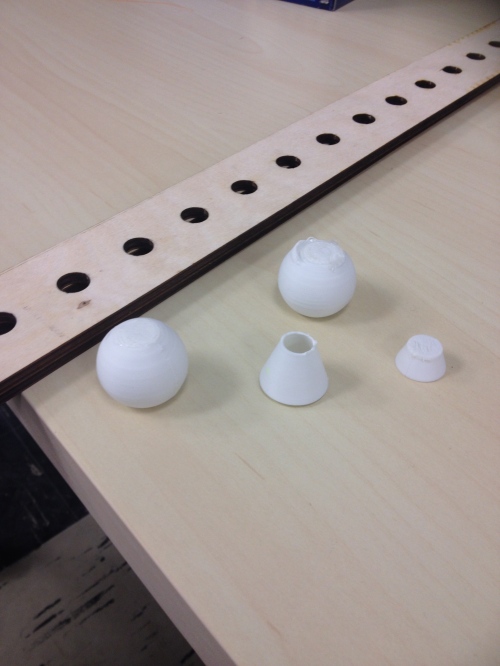
For the Physical Visual Piece, I used Rhino to create a Shadow Box and 3d printed Lightbulbs using the Cube and FormLab printers. The FormLab printer was able to print the bulbs without any issues, while the Cube required supports and the Cubify software doesnt provide this type of additive support options as the PreForm software for Formlabs does. In order to print without supports on the Cube I made the sphere flat at the top, but there were issues with printing the neck of the bulb as there was so support for it to print over/connect to, making that area brittle.
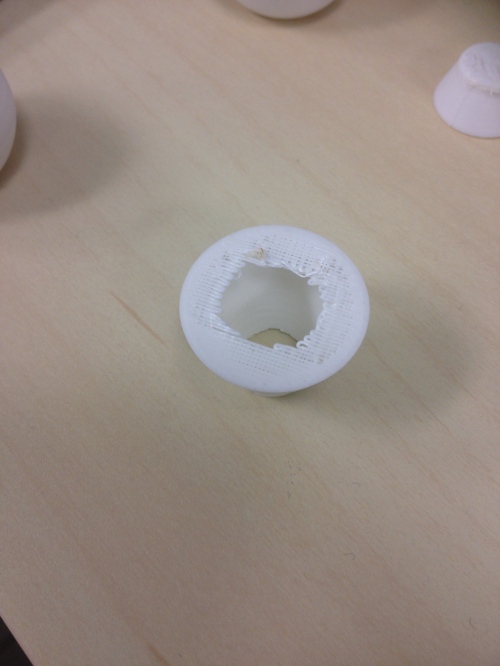
Tests to create design with Cube
I also learned that you can copy several of the same parts into a print to allow for it to print quicker using a Formlab printer, which sped up the process alot!
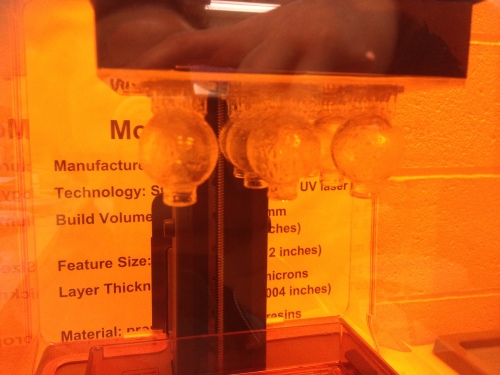
Printing with FormLab Printer
Printing with Cube
Connecting the NeoPixels to be insync with the Firmata code was hard and I am still figuring this part out better at the moment. I will post when I have this fixed!
LESSONS LEARNED:
1. I have low knowledge in Signal Processing, but it was a good start to my task of learning about wearable technology and has helped me focus on what I need to learn next semester
2. Creating the software took me time as it was hard to navigate between menus and I had trouble moving words while utilizing a timer. I spent too much time on making this work, that the end “AH HA” moment needed more attention.
3. I got to work with Max MSP and PureData which was a great opportunity, and although it was just beginning it was nice to work in both softwares and understand their basic setups better. I was previously overwhelmed by each.
4. Balancing between the physical components and software components was not easy as if one didnt work then you couldnt utilize the other.
RELATED WORK:
Athos – Athos is a wearable fitness shirt that utilizes a six-axis accelerometers, EMG to measure muscle effort, muscle target zones and muscle fatigue. Heart rate and breathing patterns are tracked to further enhance you overall performance, and this device determines your recovery rate to truly maximize your workout.
Mio Link- Heart Monitor with Bluetooth connectivity, acknowledges current training zone by color on the wristband. Images below is off of the Mio Website . It indicates the 5 heart rate zones that are tracked by the heart rate monitor.
